📁 Tools Used: Excel | Power BI | DAX | Power Query
📊 Skills Applied: Data Visualization | Business Intelligence | Customer Analytics | Predictive Analysis | Trend Analysis
📌 Overview
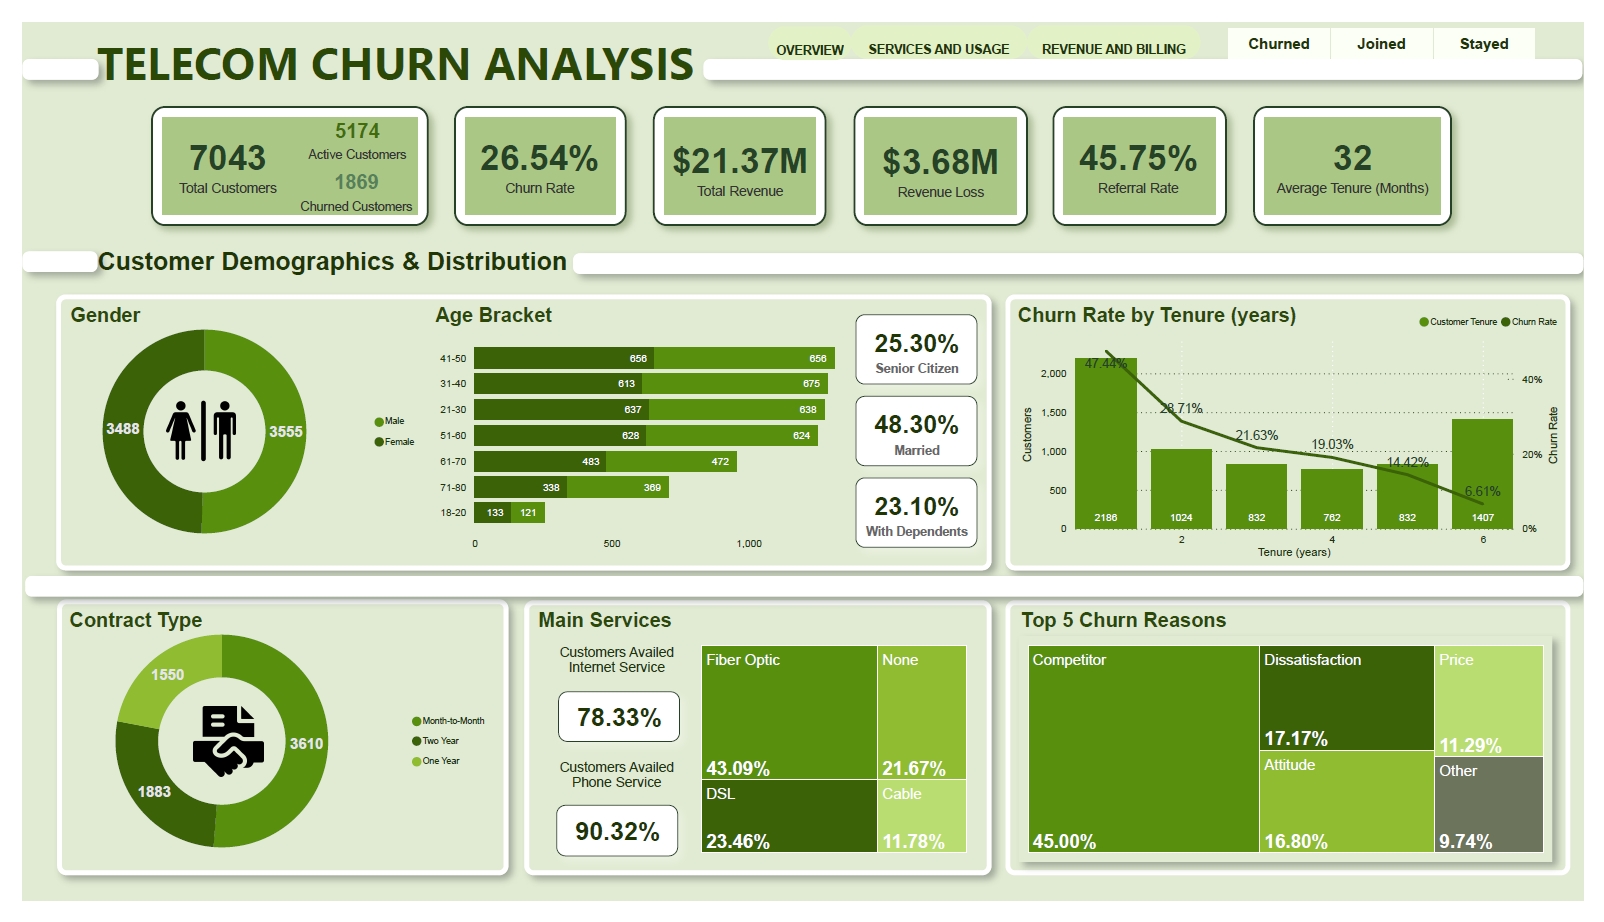
This Power BI dashboard analyzes customer churn patterns in the telecommunications industry using data from Maven Analytics (Kaggle). The goal is to identify key factors driving customer attrition, predict high-risk segments, and provide data-driven insights to improve customer retention strategies.
📌 Key Insights
Churn Rate: 26.54% of customers left the service, impacting revenue.
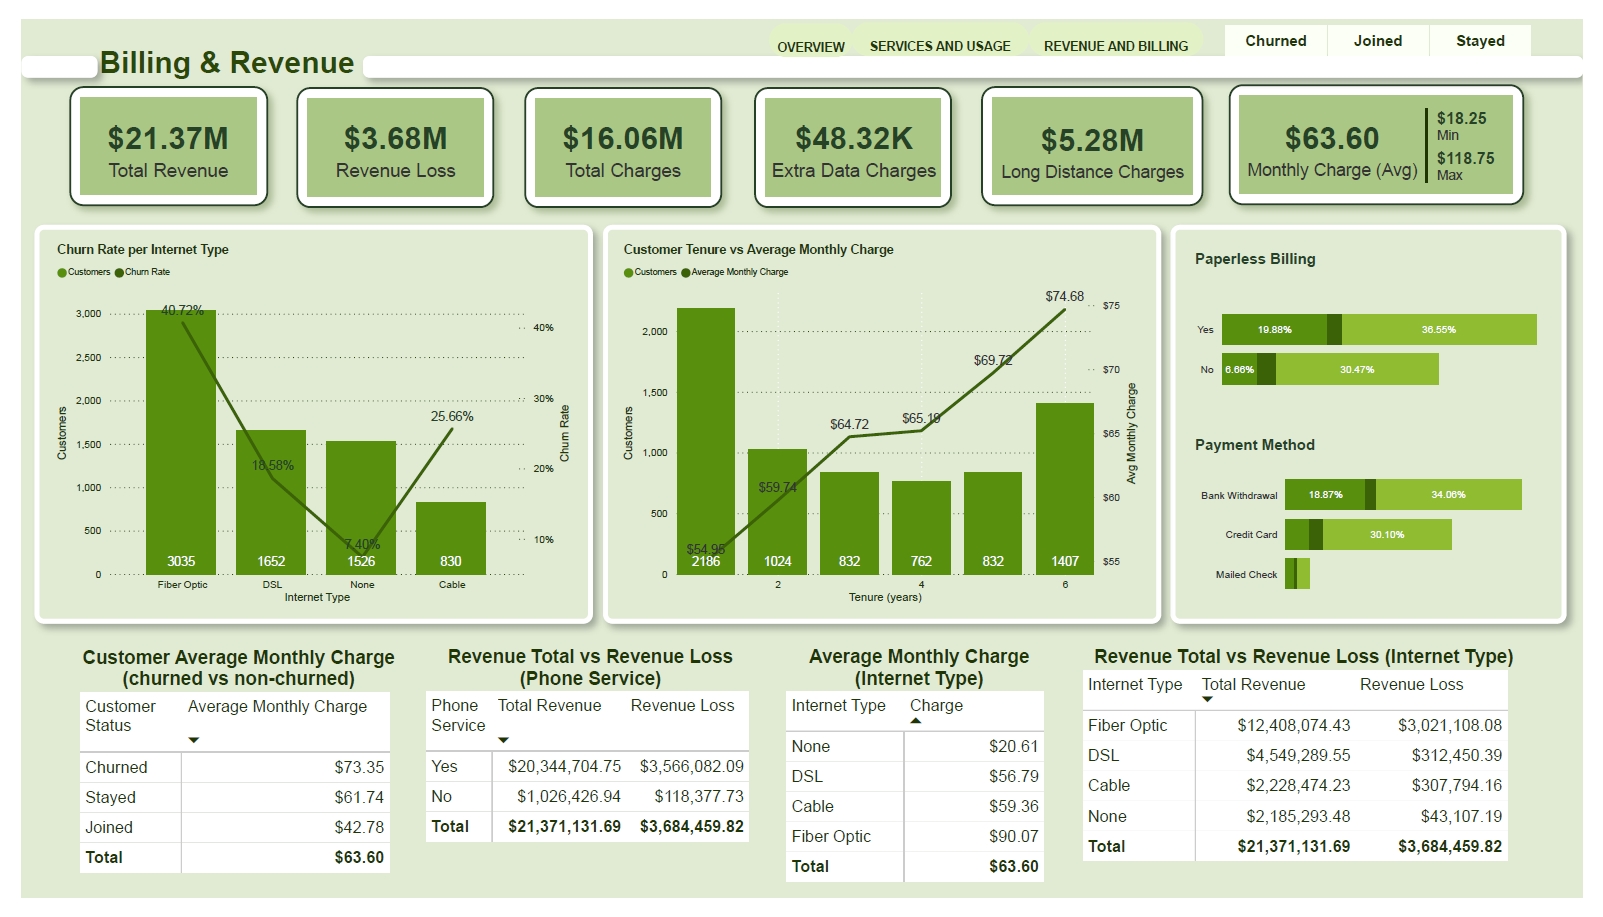
Revenue Loss: $3.68M in lost revenue due to churn.
Top Churn Factors: Competitor dissatisfaction (45%), pricing issues (17%), and customer experience (16.8%) were key drivers.