📊 Adventure Works Sales Analysis 📊 Project Type: Sales Performance Analysis 📁 Tools Used: Excel | Power BI | DAX | Power Query 📊 Skills Applied: Data Visualization | Business Intelligence | Sales Analysis | Trend Analysis | Geospatial Analytics
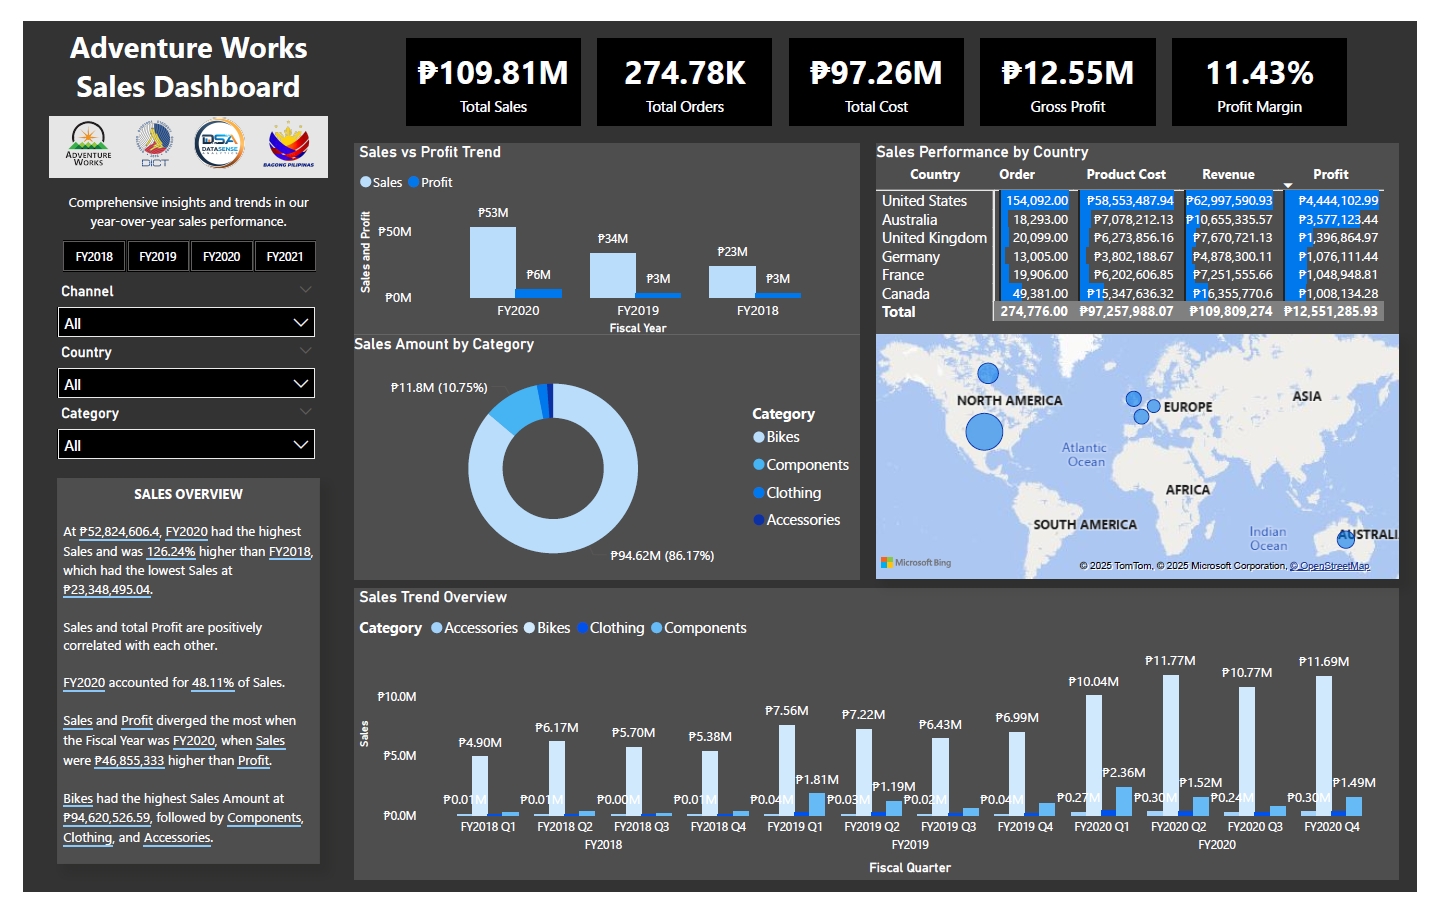
📌 Overview This Power BI dashboard provides a comprehensive sales analysis of Adventure Works, offering dynamic insights into total sales, orders, cost, profit, and profit margin. It helps businesses track year-over-year sales trends, identify high-performing product categories, and analyze geographical sales performance for data-driven decision-making.
📌 Key Insights Year-over-Year Sales & Profit Trends: FY2020 recorded the highest sales, 126.24% higher than FY2018. Sales by Category: Bikes contribute the highest revenue (86.17%), followed by Components, Clothing, and Accessories. Country-wise Performance: The United States leads in sales volume and revenue, followed by Australia and the UK. Sales Trend Overview: Breakdown of quarterly sales performance across multiple fiscal years. Interactive Filtering: Users can dynamically filter by fiscal year, channel, country, and category to uncover specific trends. Geospatial Sales Analysis: Provides a map visualization of sales distribution across different countries.
📌 Tools & Techniques Used Power BI – Data visualization & dashboard development DAX (Data Analysis Expressions) – Advanced calculations & KPI metrics Power Query – Data cleaning & transformation Excel – Data cleaning & transformation Geospatial Analytics – Sales performance mapping by country
📌 Dashboard Preview
📌 Interactive Dashboard Preview
📌 Want to See More? 📂 Download the PBIX file here.