SALES DASHBOARD - Microsoft Excel
Sample Sales Dashboard
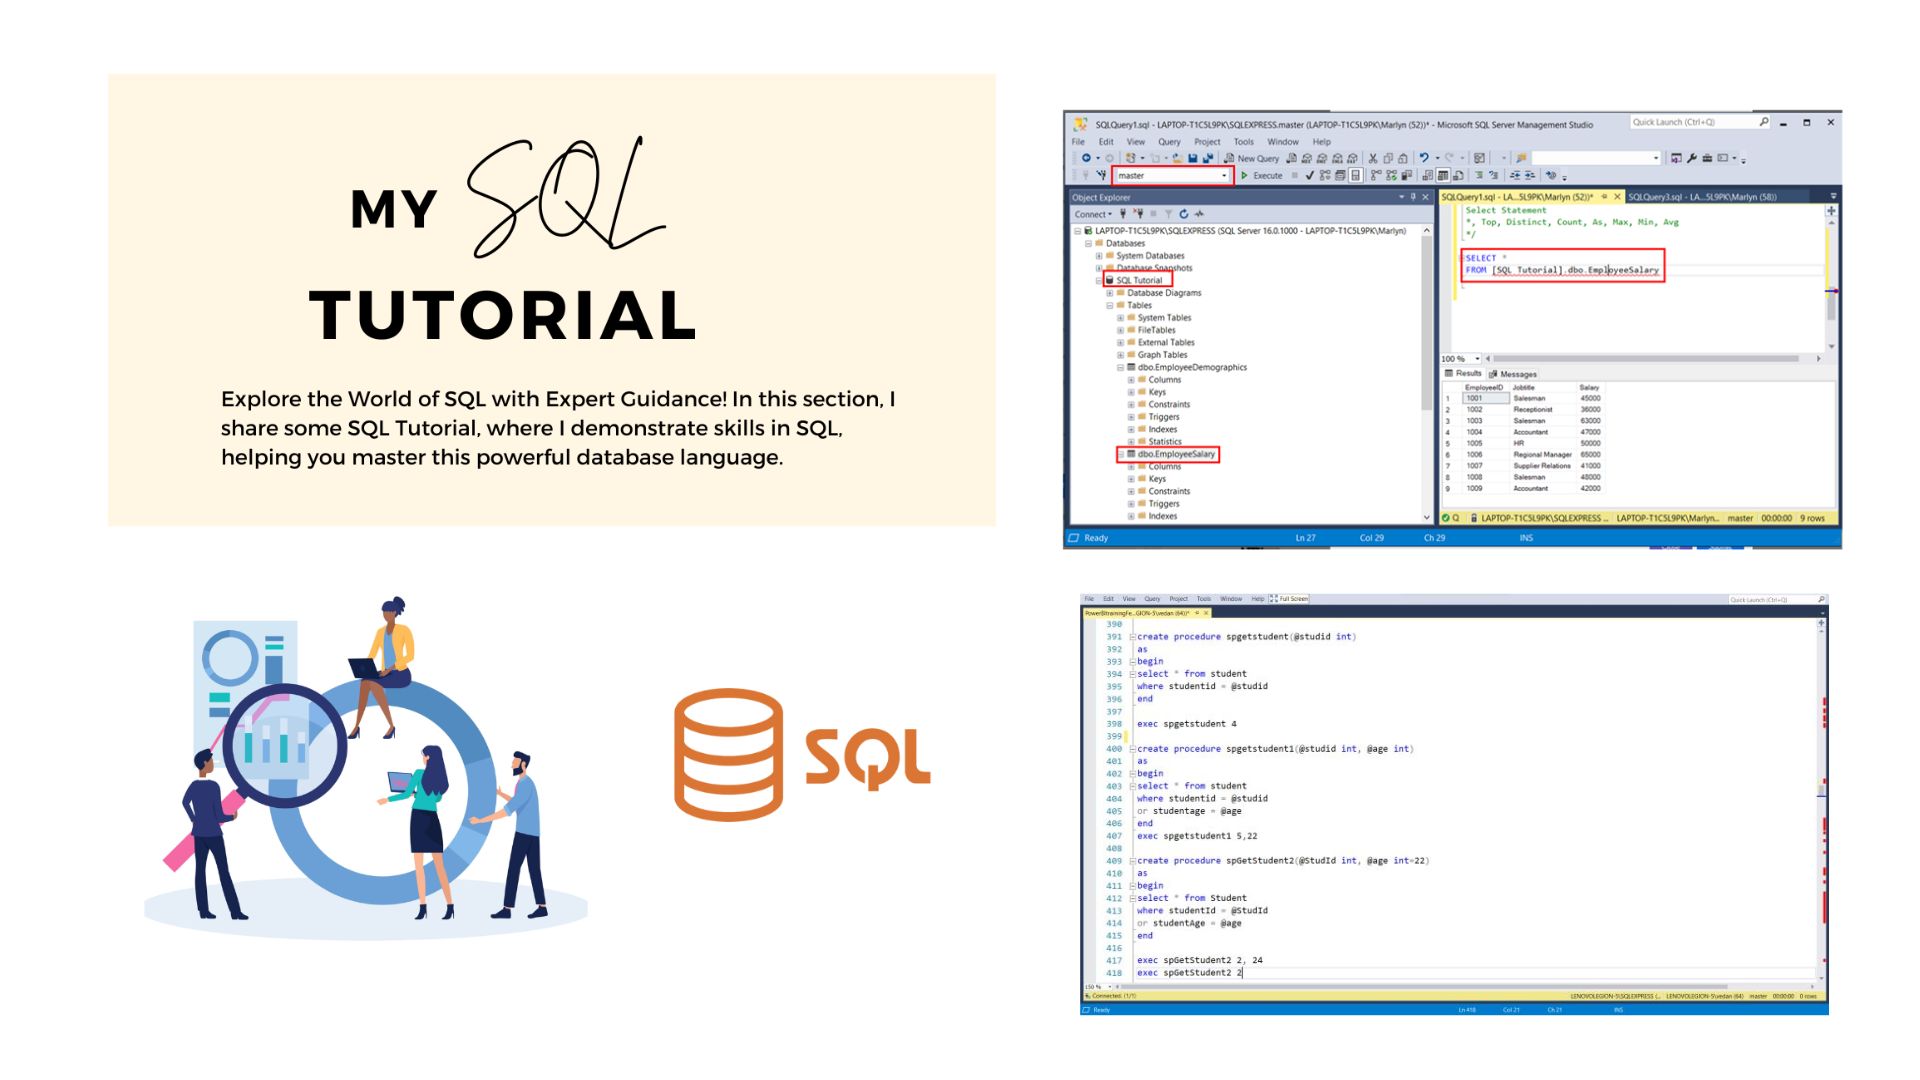
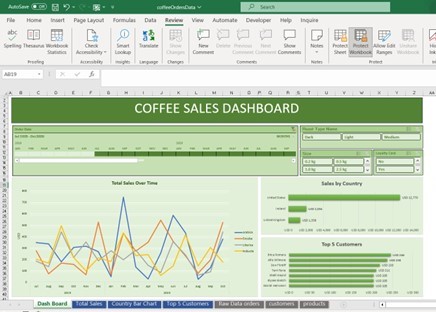
I've created a straightforward "Sales Order Dashboard" in Microsoft Excel to showcase my skills in data handling, cleaning, and visualization. This Excel-based dashboard illustrates my ability to use essential functions like IF statements, INDEX & MATCH formulas, Pivot Tables, and basic data formatting techniques.
Highlights:
𝐂𝐥𝐞𝐚𝐧𝐞𝐝 𝐃𝐚𝐭𝐚: I started by tidying up the sales data, removing duplicates, filling in missing information, and ensuring data consistency.
𝐄𝐚𝐬𝐲 𝐋𝐨𝐨𝐤𝐮𝐩 : I've made it simple to find relevant data using basic functions like IF statements and INDEX & MATCH formulas.
𝐁𝐚𝐬𝐢𝐜 𝐕𝐢𝐬𝐮𝐚𝐥𝐢𝐳𝐚𝐭𝐢𝐨𝐧 : This dashboard includes Pivot Tables for summarizing and categorizing data, allowing for straightforward analysis.
𝐂𝐥𝐞𝐚𝐫 𝐅𝐨𝐫𝐦𝐚𝐭𝐭𝐢𝐧𝐠 : To make the dashboard easy on the eyes, I've used simple formatting techniques such as color-coding cells and basic number formatting.
𝐔𝐬𝐞𝐫-𝐅𝐫𝐢𝐞𝐧𝐝𝐥𝐲 : The dashboard is designed to be user-friendly. Users can filter data by date, product, or customer, and generate basic charts to better understand sales performance.
𝐊𝐞𝐲 𝐒𝐚𝐥𝐞𝐬 𝐌𝐞𝐭𝐫𝐢𝐜𝐬 : It provides essential sales insights, like revenue to help users make informed decisions.
In essence, this Simple Sales Order Dashboard in Microsoft Excel highlights my ability to work with data effectively, making it more accessible and useful for decision-making.