Data Visualization - POWER BI
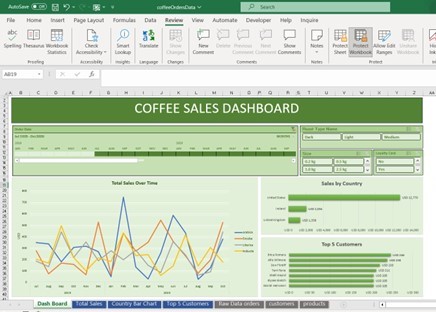
I've recently learned a lot about Power BI, which is a tool that helps analyze data. As a Data Analyst, I discovered how to use it to get information from different places, like databases and spreadsheets. I also learned to clean up and organize data so it's accurate.
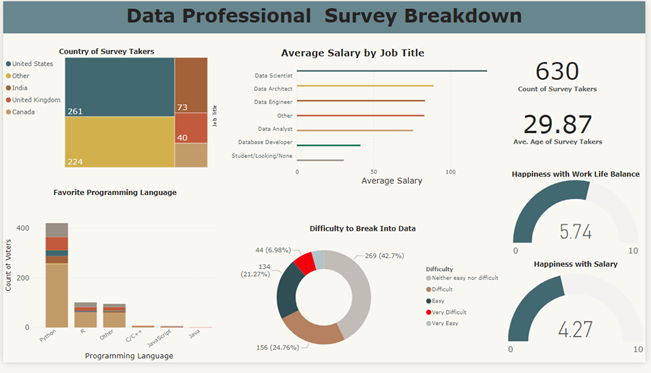
With Power BI, I can make cool charts and graphs to show data in an easy way. I can even use it to predict things with the help of computers.
Sharing data with others is easy using Power BI. I can create reports and share them with my team.
In short, my Power BI learning journey has given me skills that are important for a Data Analyst job. It helps me collect, clean, and show data, making it easier for everyone to make smart decisions.