Reports and Analysis

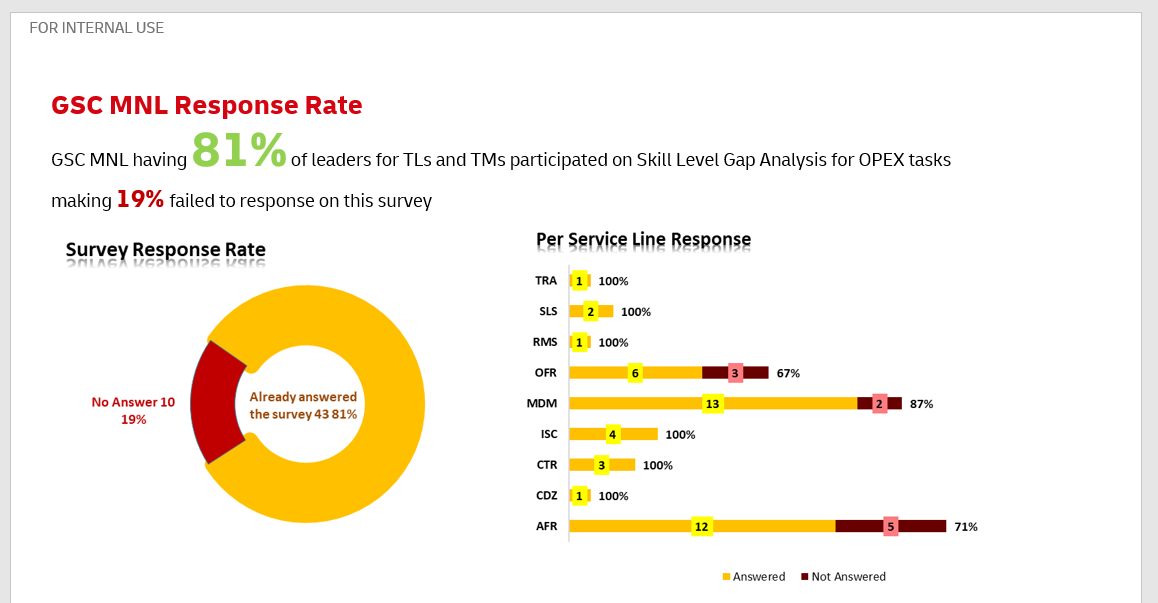
Sample Report that was shared in providing the Center response rate and with the usage of Doughnut and Bar graphs presentation.
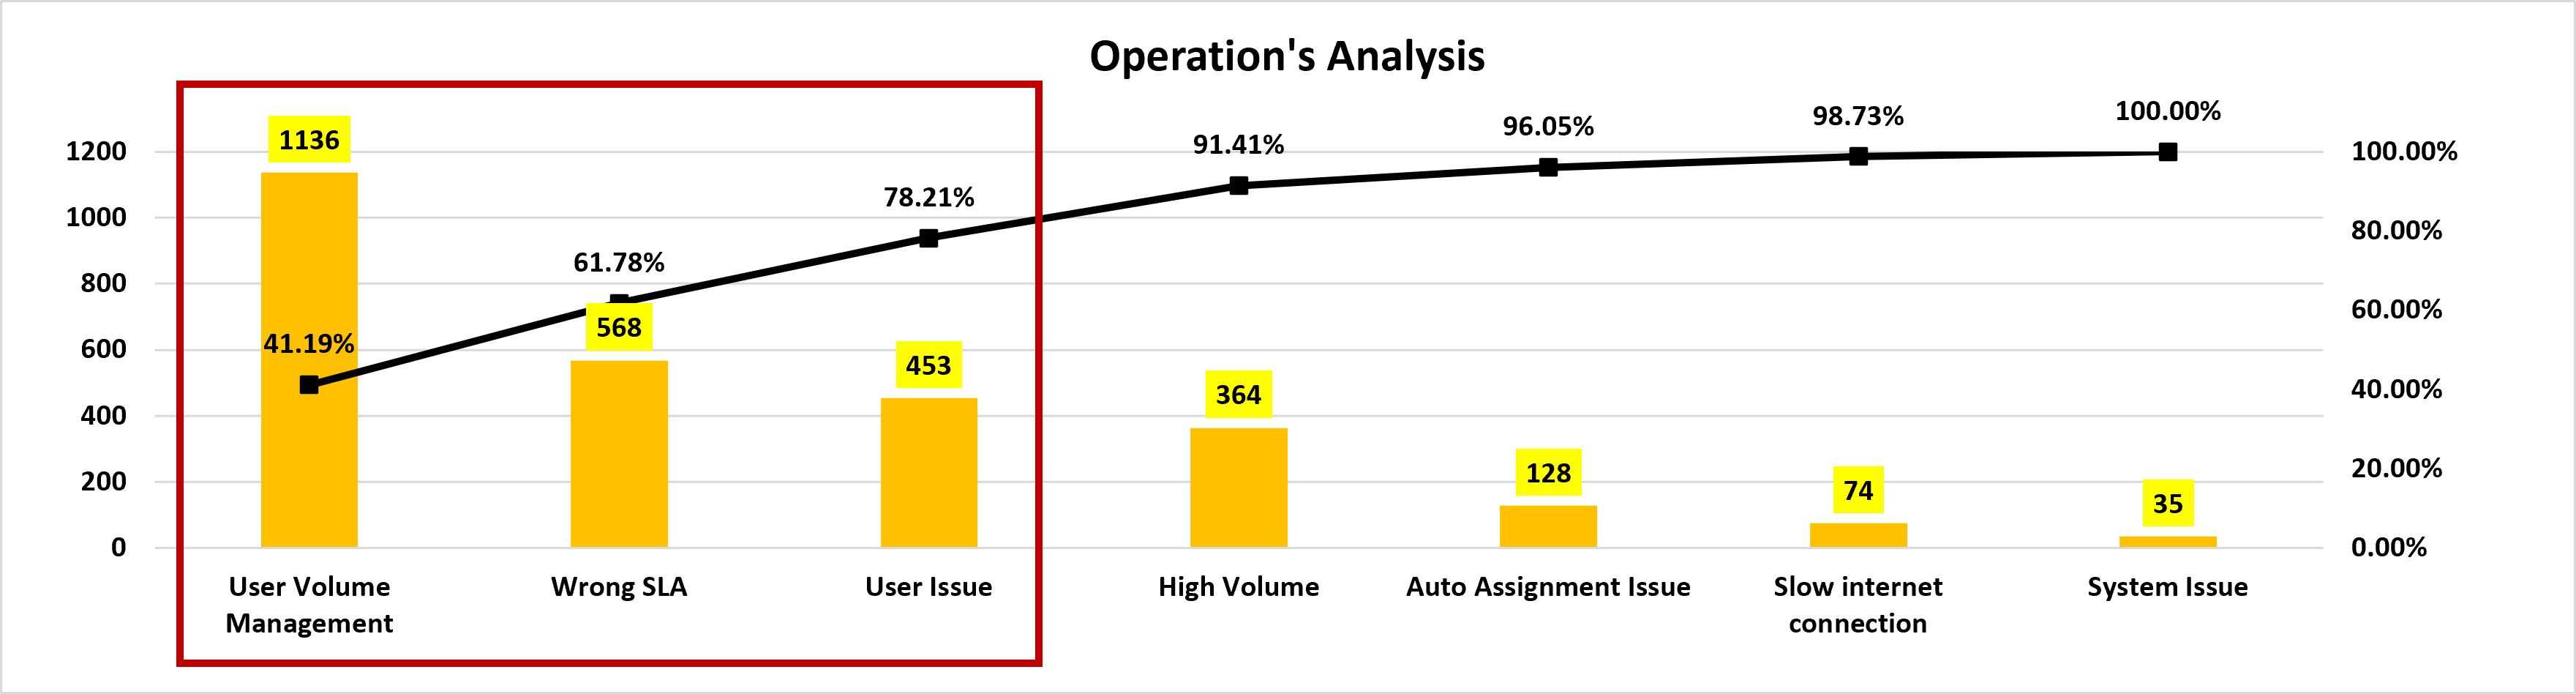
Pareto analysis in identifying top priority issues need to be resolved using 80/20 rule
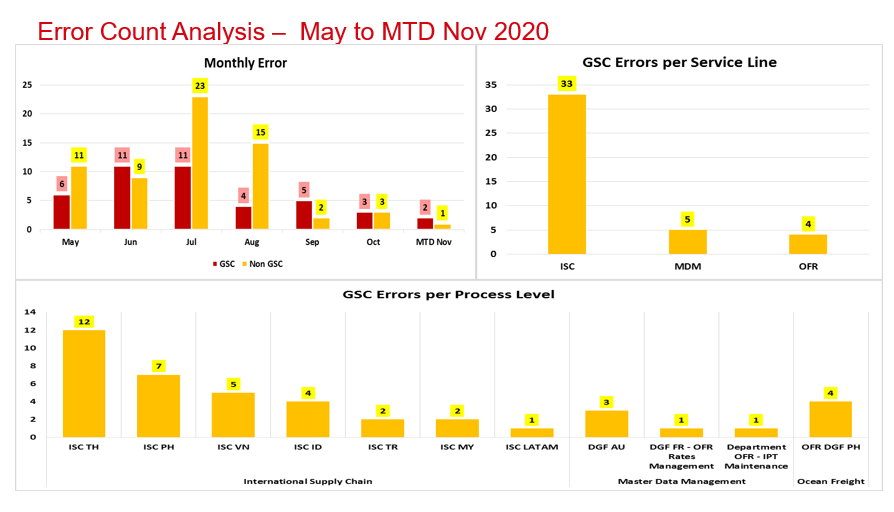
Error Analysis sample Report
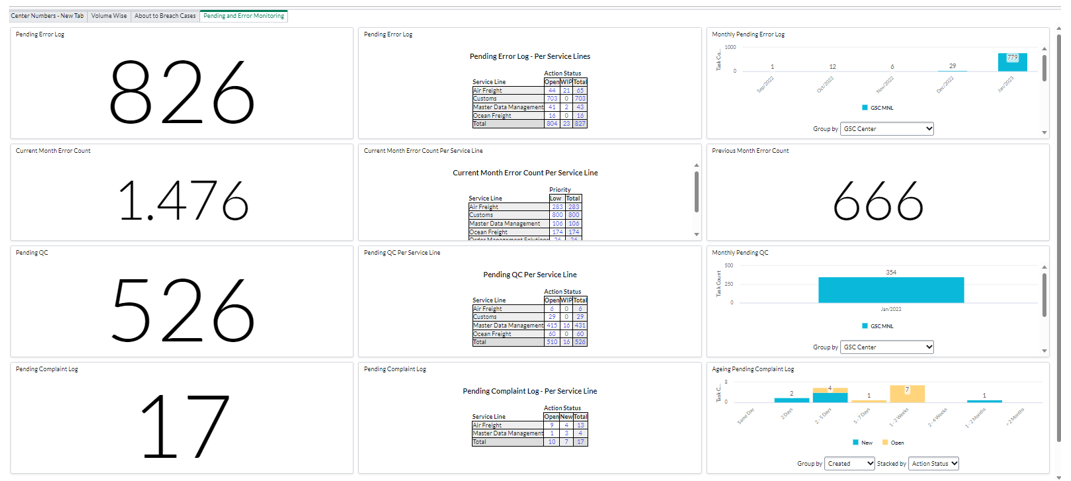
Dashboard created using our company owned ticketing tool to view the center wide counts and status across different service lines
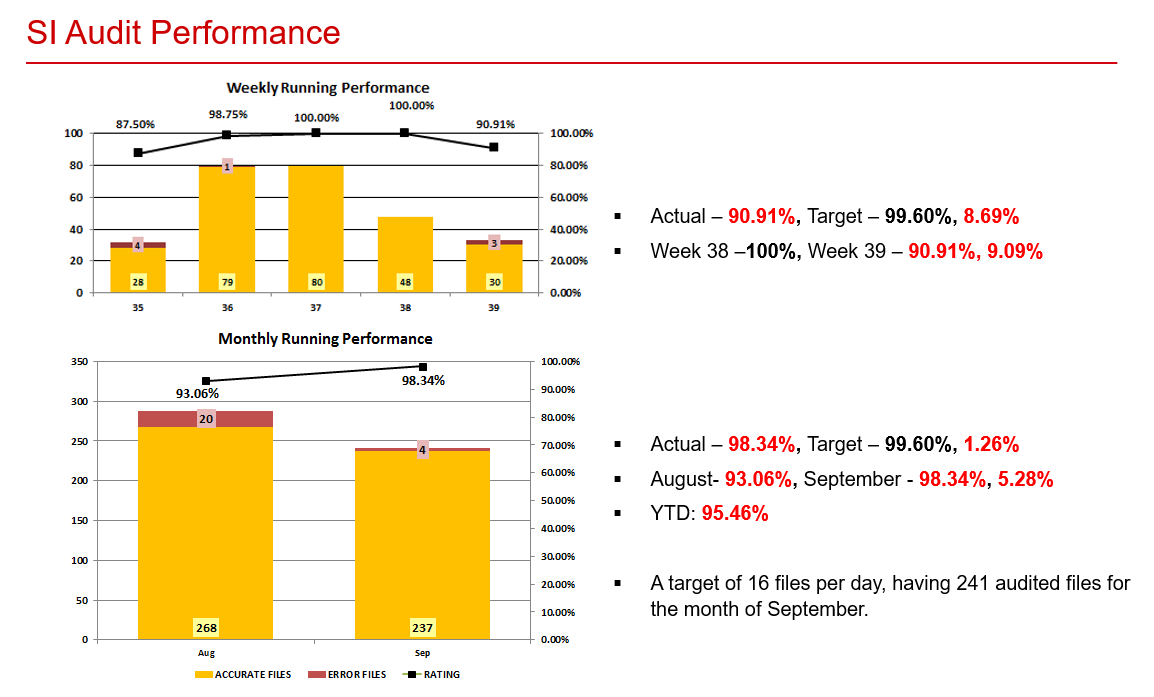
Audit Performance Sample Report
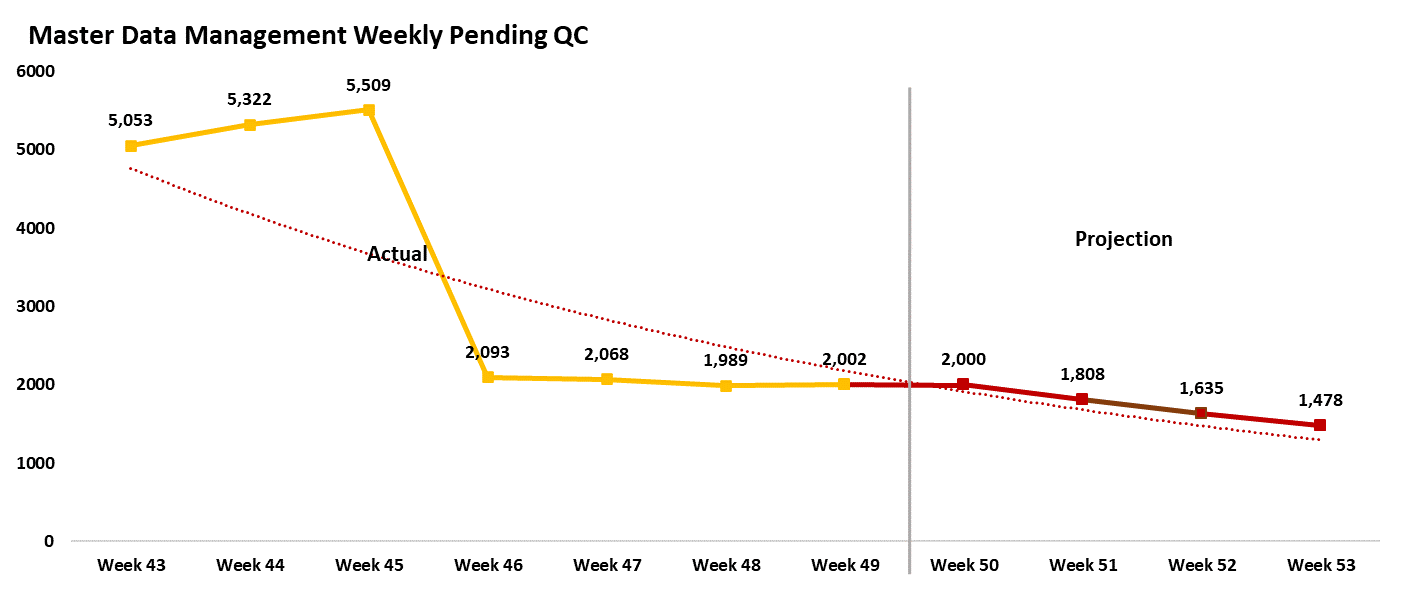
Provide forecasting analysis to show the projected trend based on data upon coming weeks
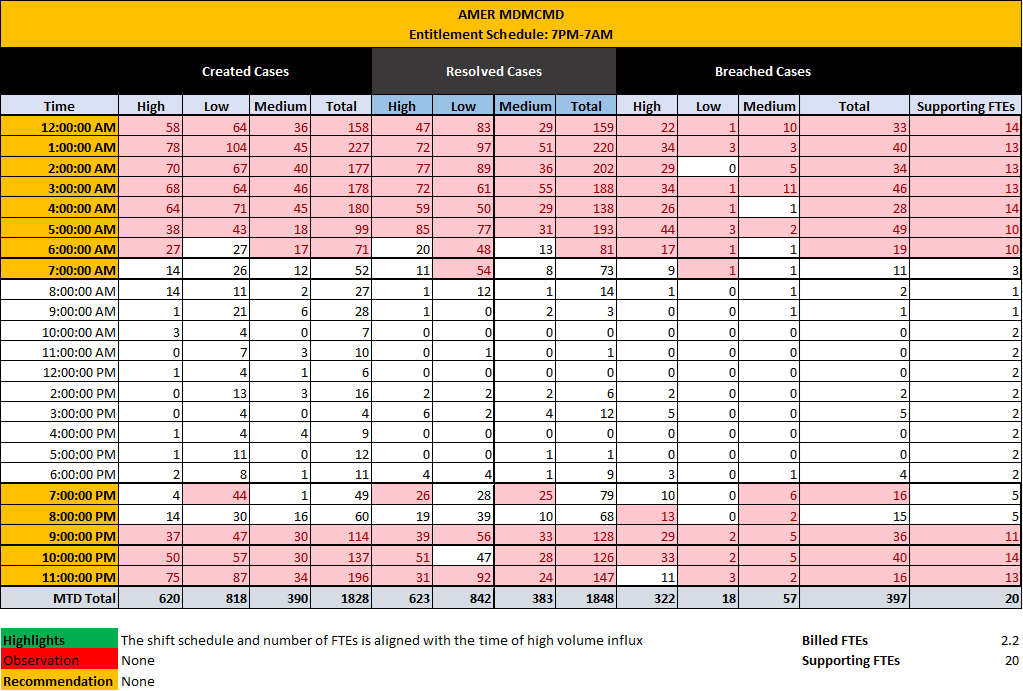
Hourly volume arrival pattern of received and resolved ticket against the current headcount on the floor during supporting business hours
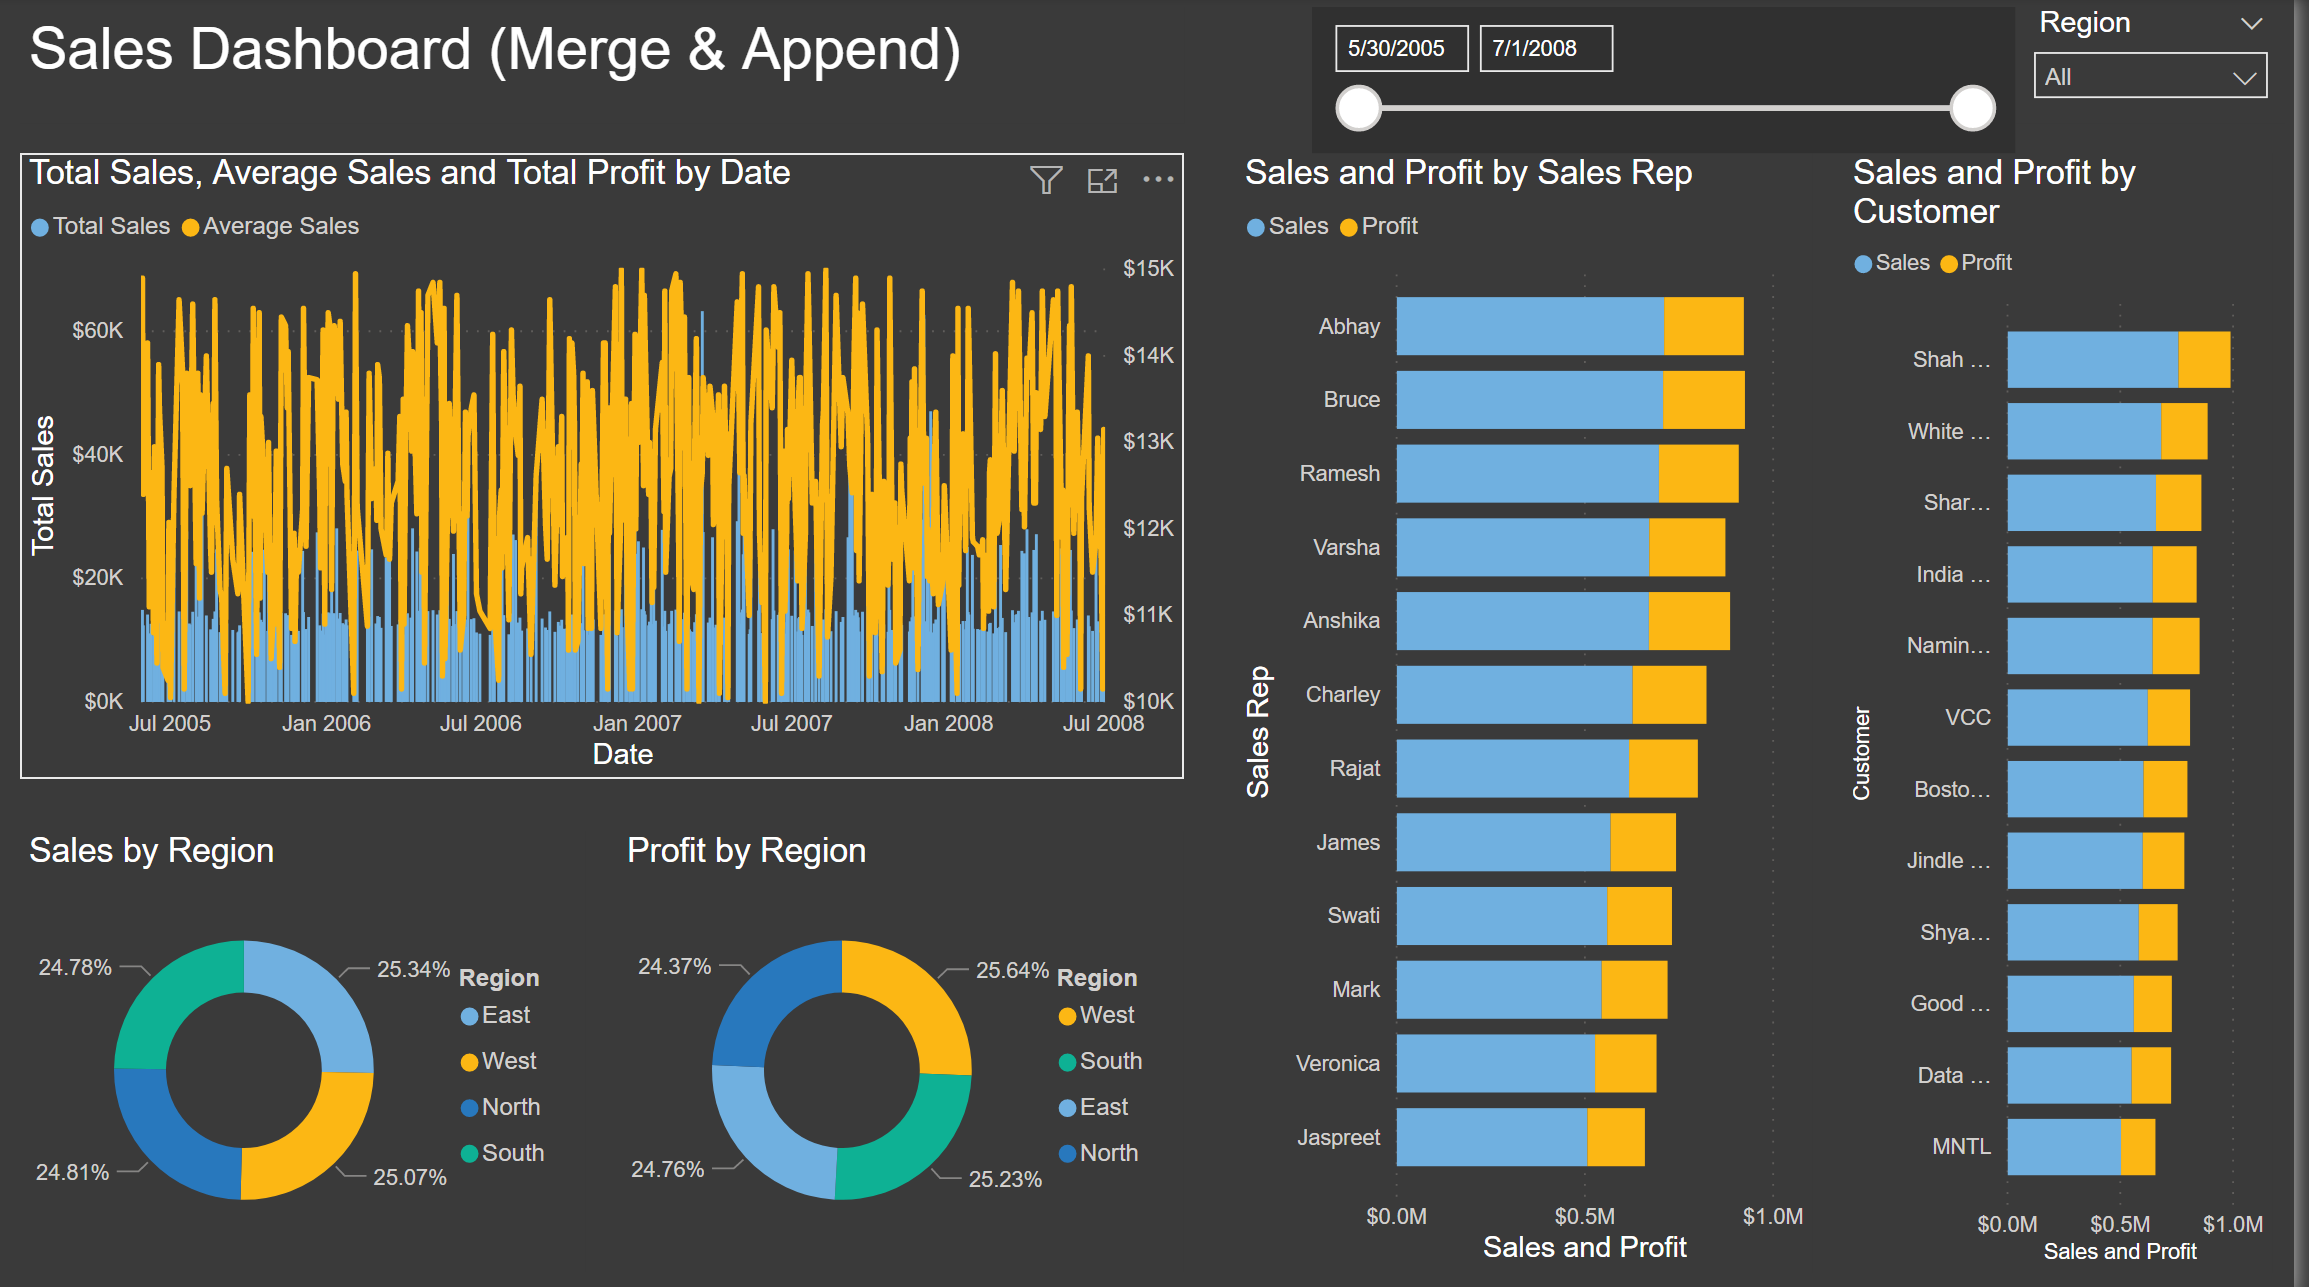 PowerBI Dashboard
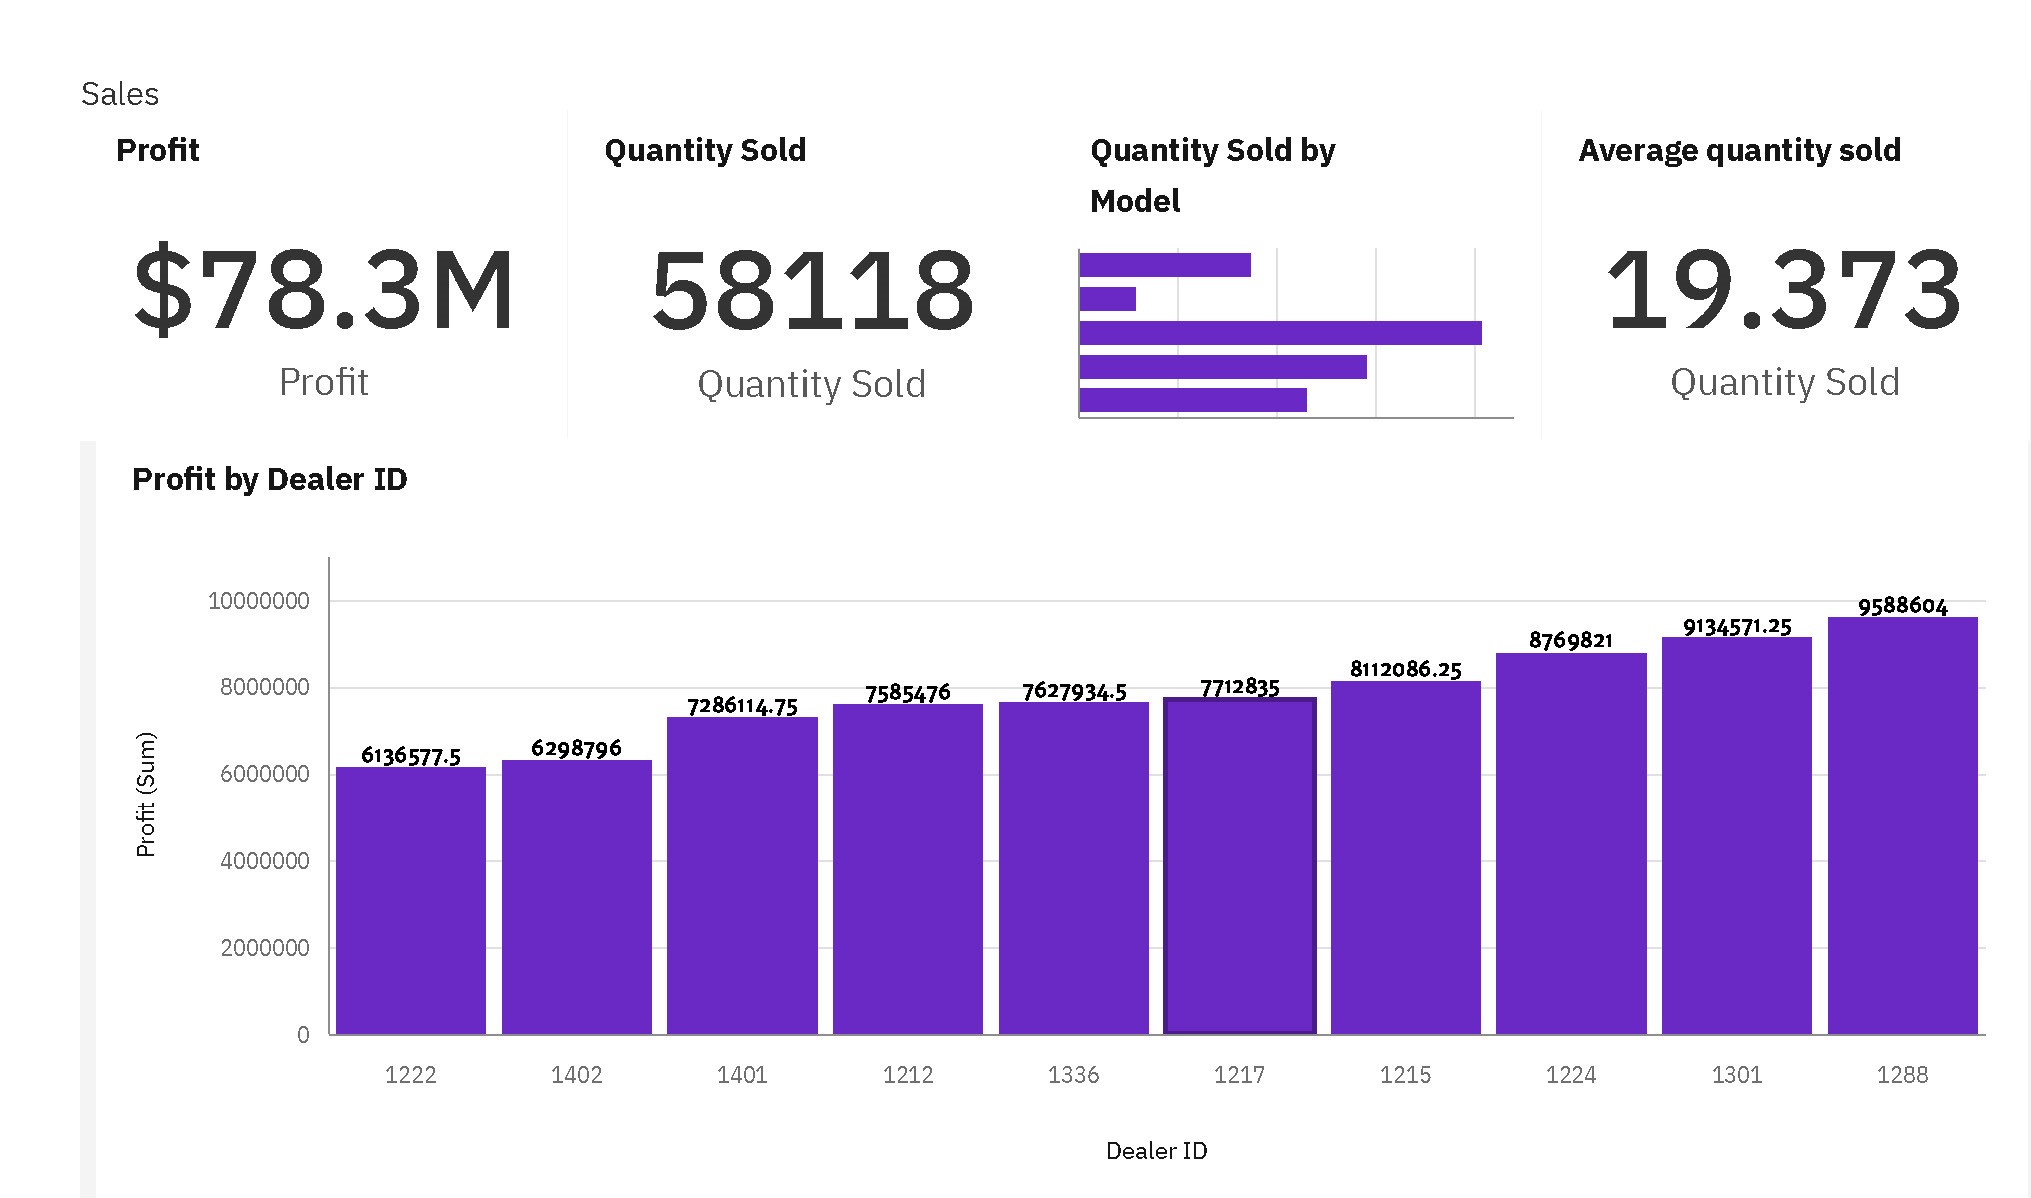
IBM Cognos Analytics