Social Media Support with Basic Graphic Designs
This section features my 3-month social media work (August–November), with content and graphics created in Canva Pro and captions planned with ChatGPT.
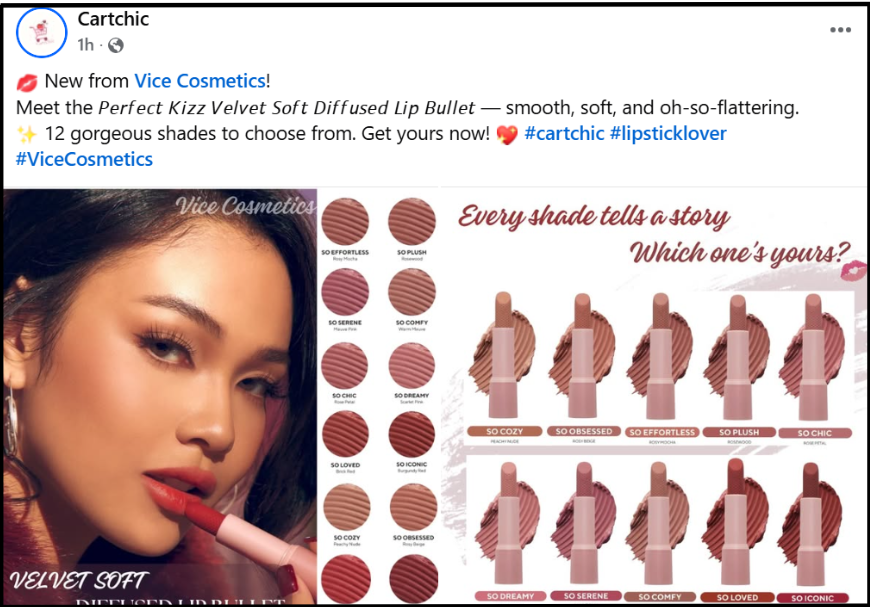
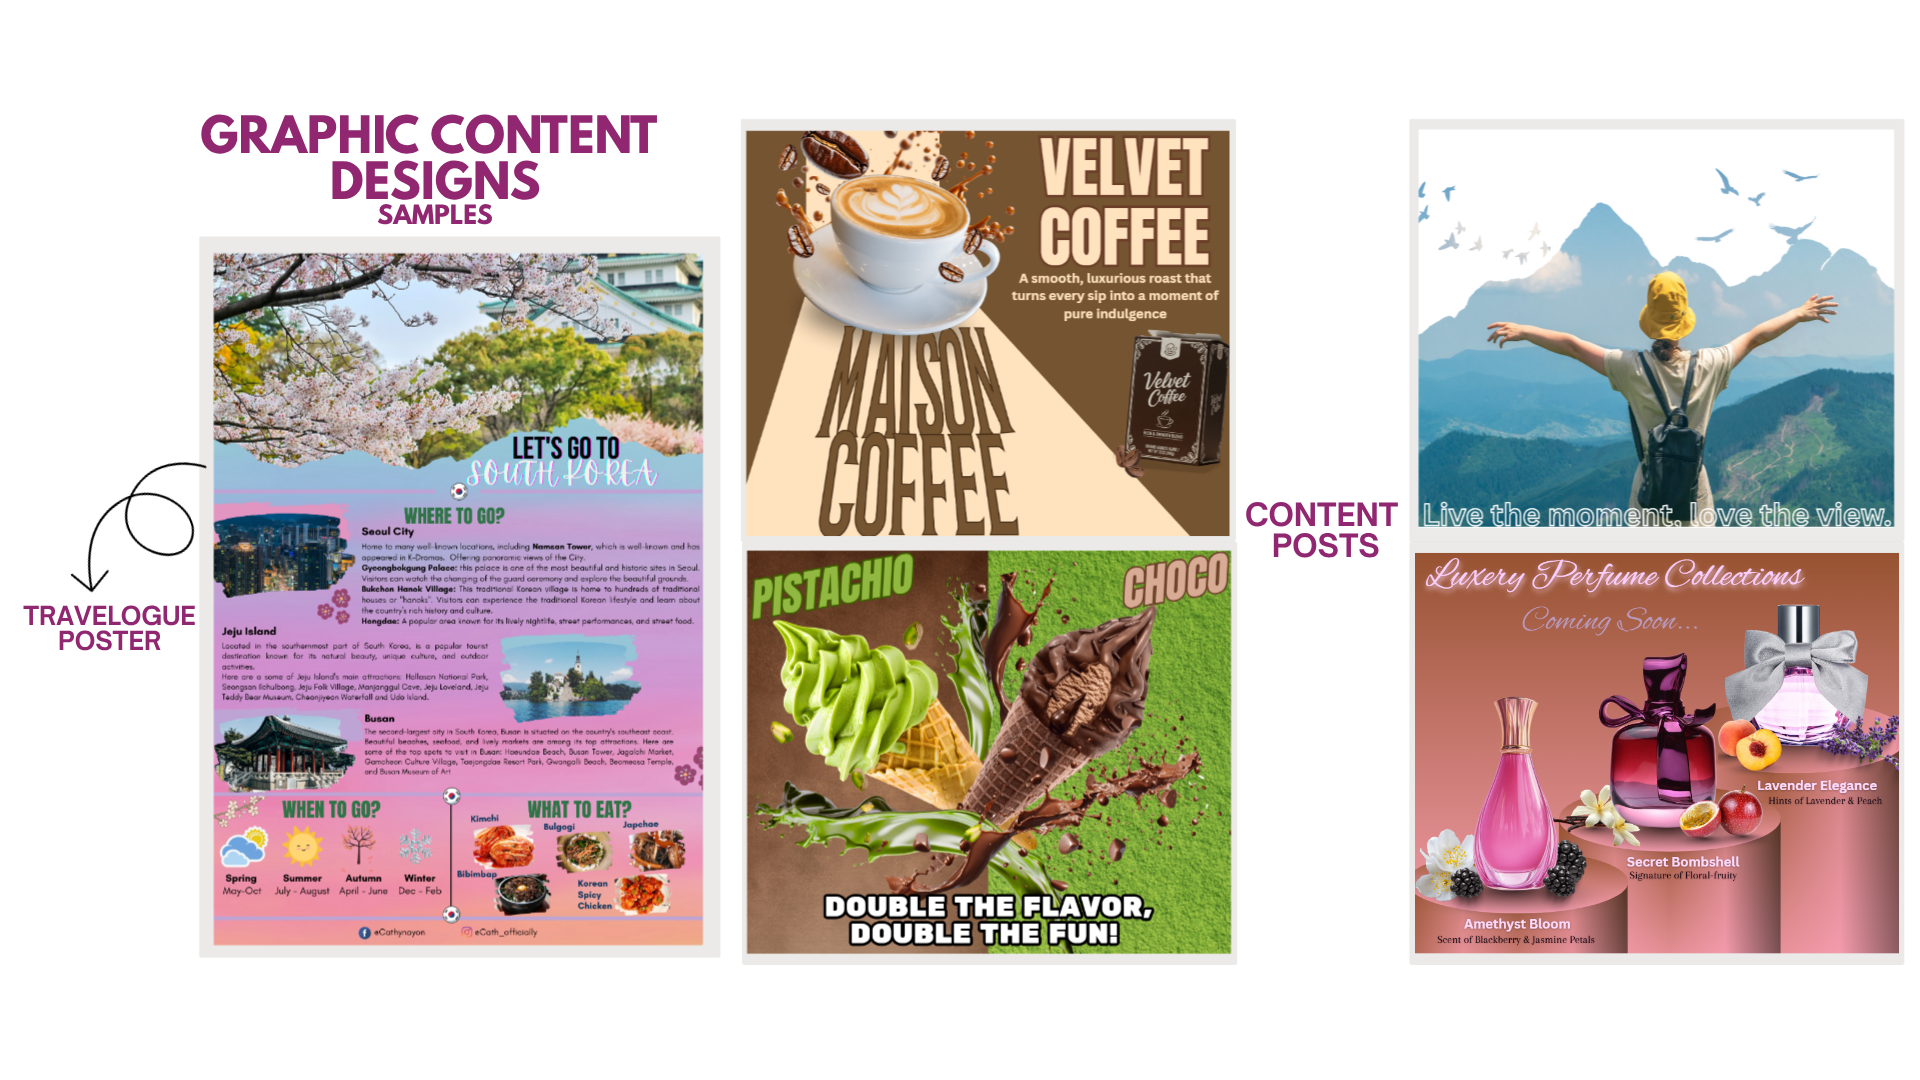
Canva-Designed Content Post – Product Feature
---
Social Media Analytics Overview
(from my affiliate page)
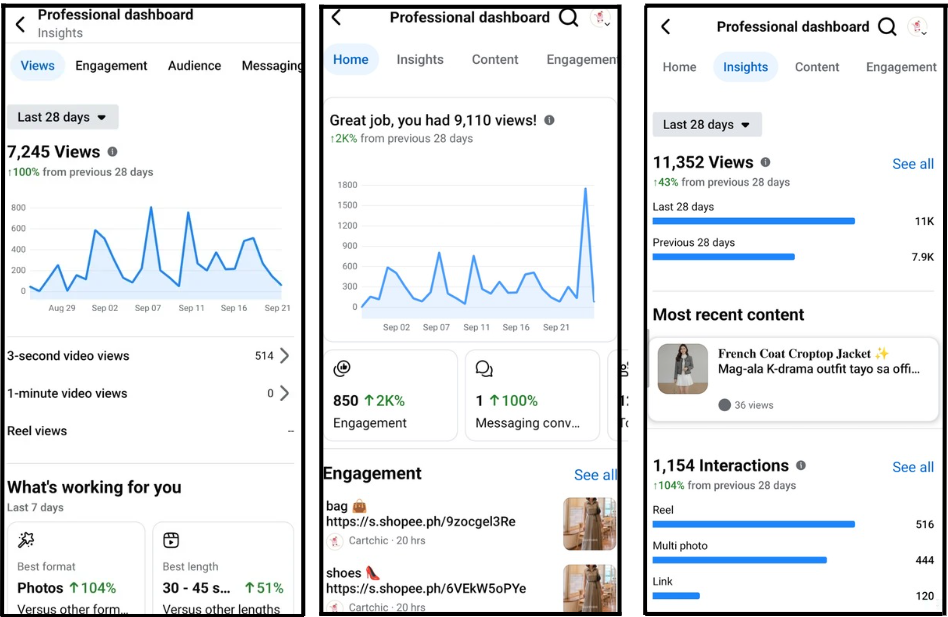
I launched my affiliate Facebook page on August 25, 2025. From launch through November 2025, the page showed steady and consistent growth in views and engagement, reflecting effective content management and basic graphic design application.
Within a few weeks, the page showed consistent growth:
- Views increased from 7,245 → 9,110 → 11,352 (+43% in the latest 28 days)
- Engagement jumped to 1,154 interactions (+104%)
- Top-performing formats: Photos (+104%), Reels, and multi-photo posts
- Most recent content: Fashion post that gained steady views and reach
I created all graphics in Canva, optimized captions using ChatGPT, and monitored performance through the Meta Professional Dashboard.
These insights show my ability to design content, analyze metrics, and improve reach and engagement using data-driven strategy.
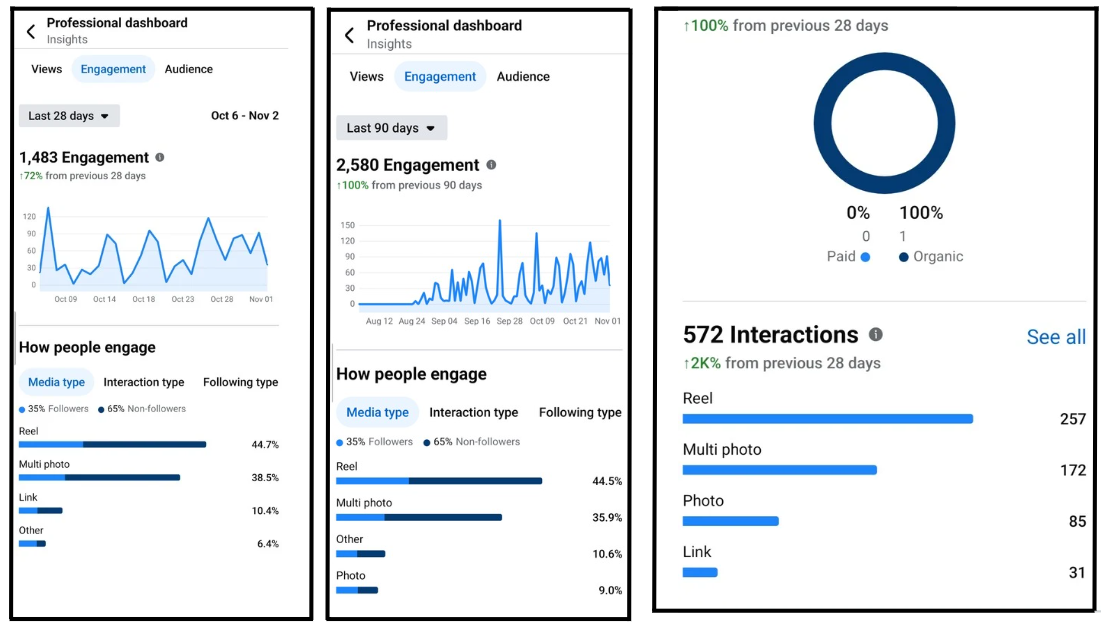
Engagement Insights - Summary (28 days VS 90 days)
All results shown are from pure organic efforts, with 0 paid promotions.
Over the last 28 days, my page achieved: 1,483 engagements (+72%)
Engagement driven mainly by:
- Reels – 44.7%
- Multi-photo posts – 38.5%
- Links & other formats – 16% combined
For the last 90 days, performance continued to rise:
- 2,580 total engagements (+100%)
- Consistent daily interaction growth shown in the engagement graph
Additional Insight
-65% of engagement came from non-followers, showing my content successfully reached new audiences
- Reels remain the strongest driver of engagement across both 28-day and 90-day periods
- The dashboard shows a steady upward trend, reflecting consistent posting and active community management.
Overall, these results highlight my ability to grow engagement organically through consistent content, audience interaction, and data-driven strategy.
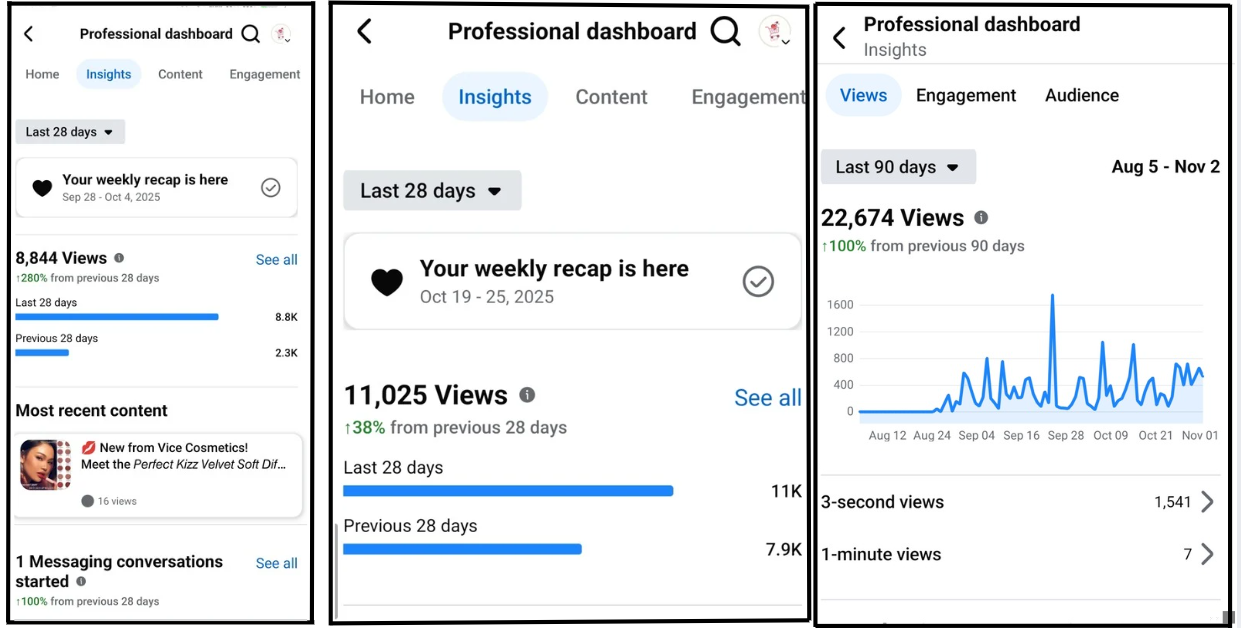
Recap - Summary
These screenshots highlight the performance improvement and audience growth based on my social media support and content creation work:
-
Weekly Views Growth:
Increased from 8,844 views (Sept 28–Oct 4) to 11,025 views (Oct 19–25) after applying consistent posting, optimized captions, and improved graphics. -
90-Day Results:
Achieved a total of 22,674 views over a 90-day period, showing steady reach growth and strong engagement peaks.
This reflects my ability to manage content, utilize basic graphic design, and analyze insights to boost visibility and engagement.
---