Data Entry Specialist

Title: RTV (Return to Vendor) Monthly Monitoring
Description:
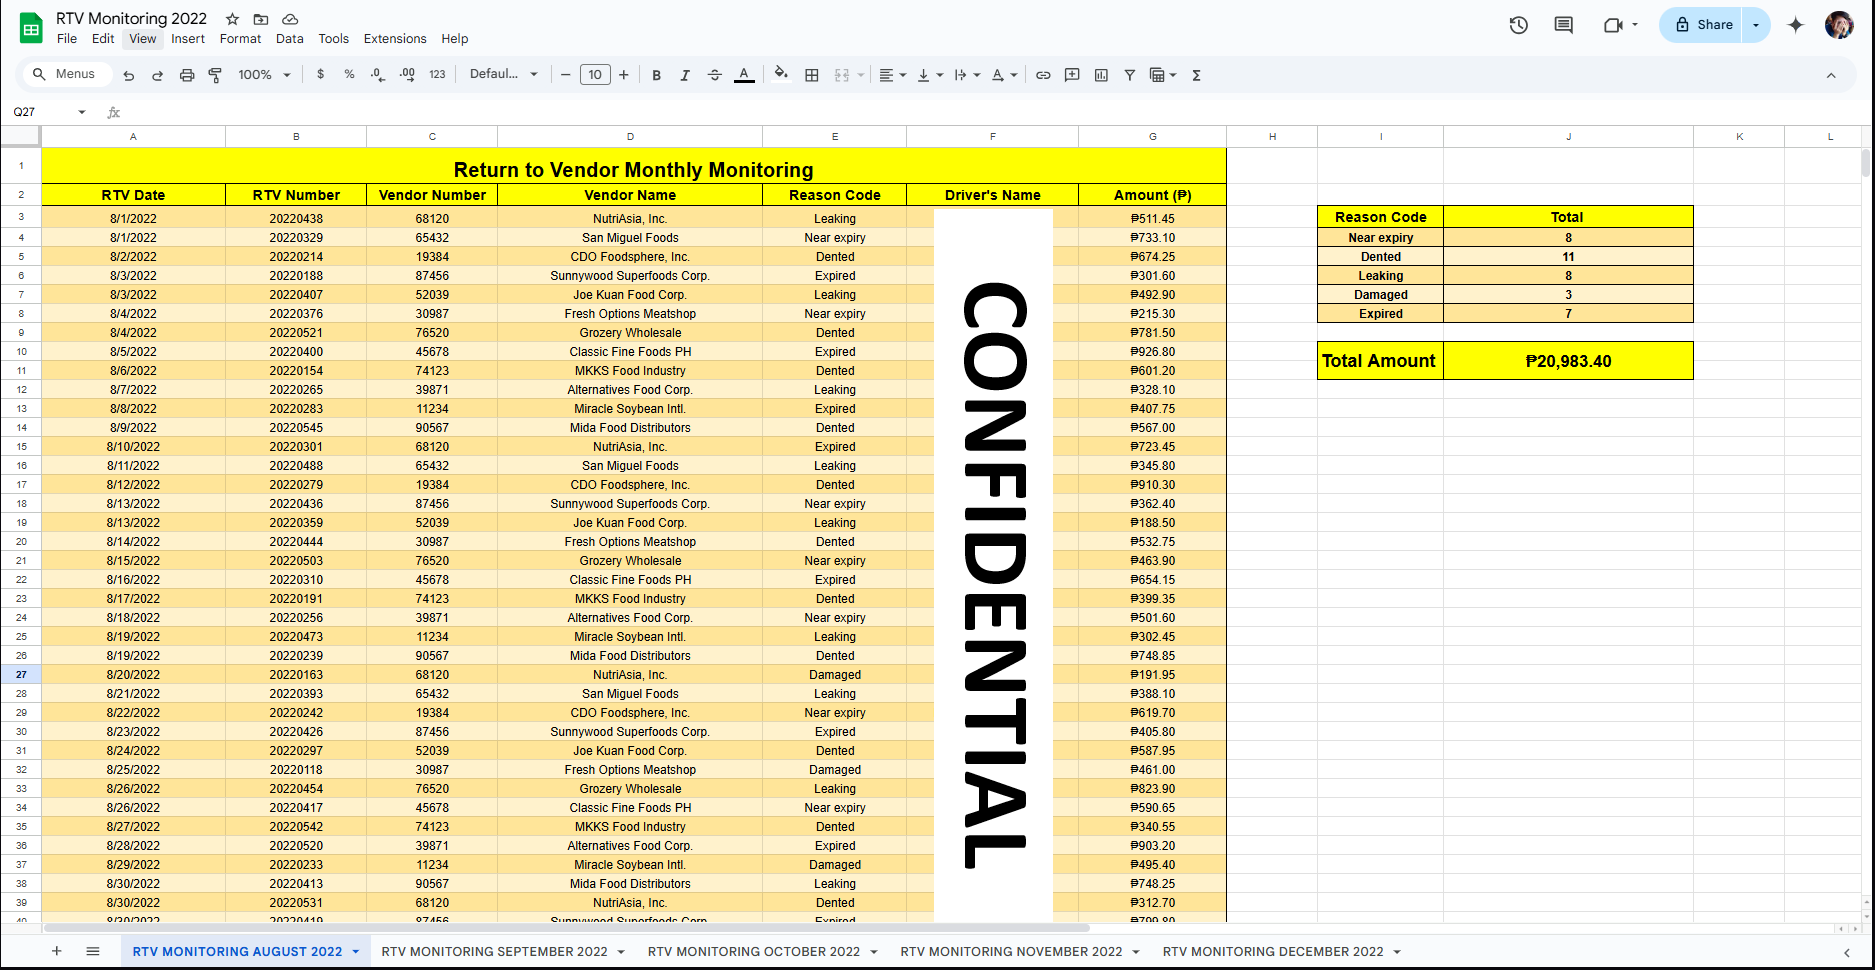
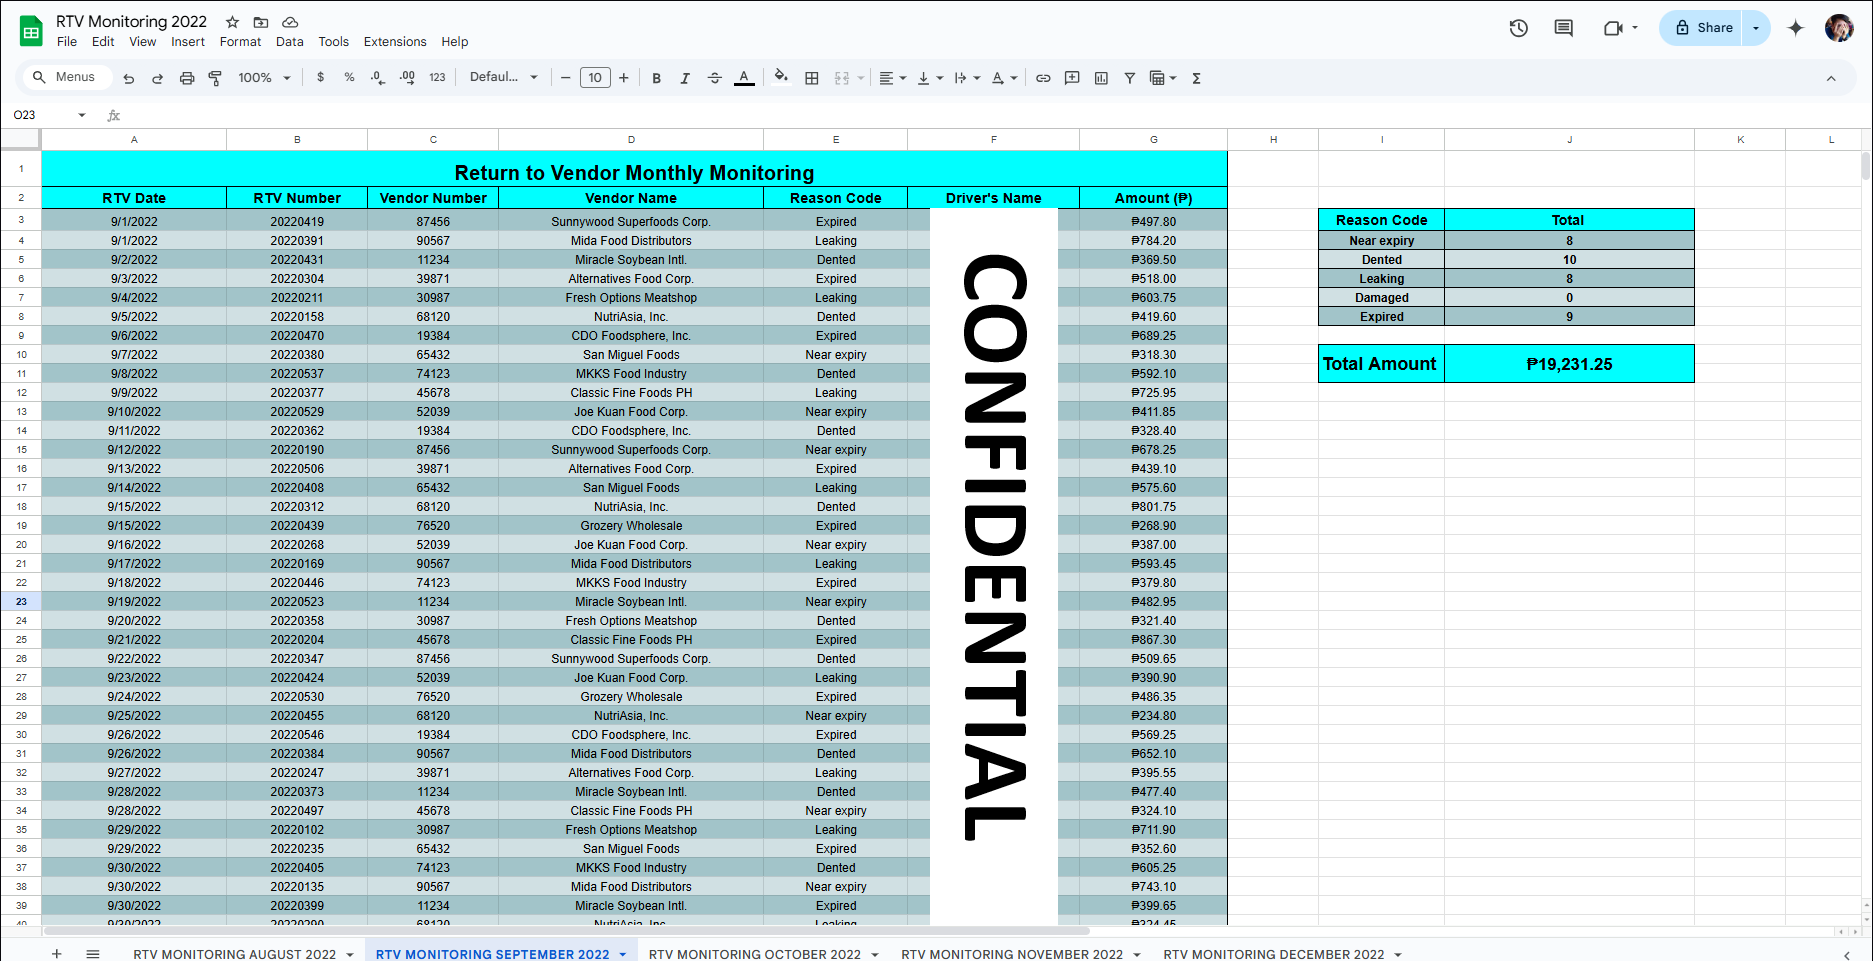
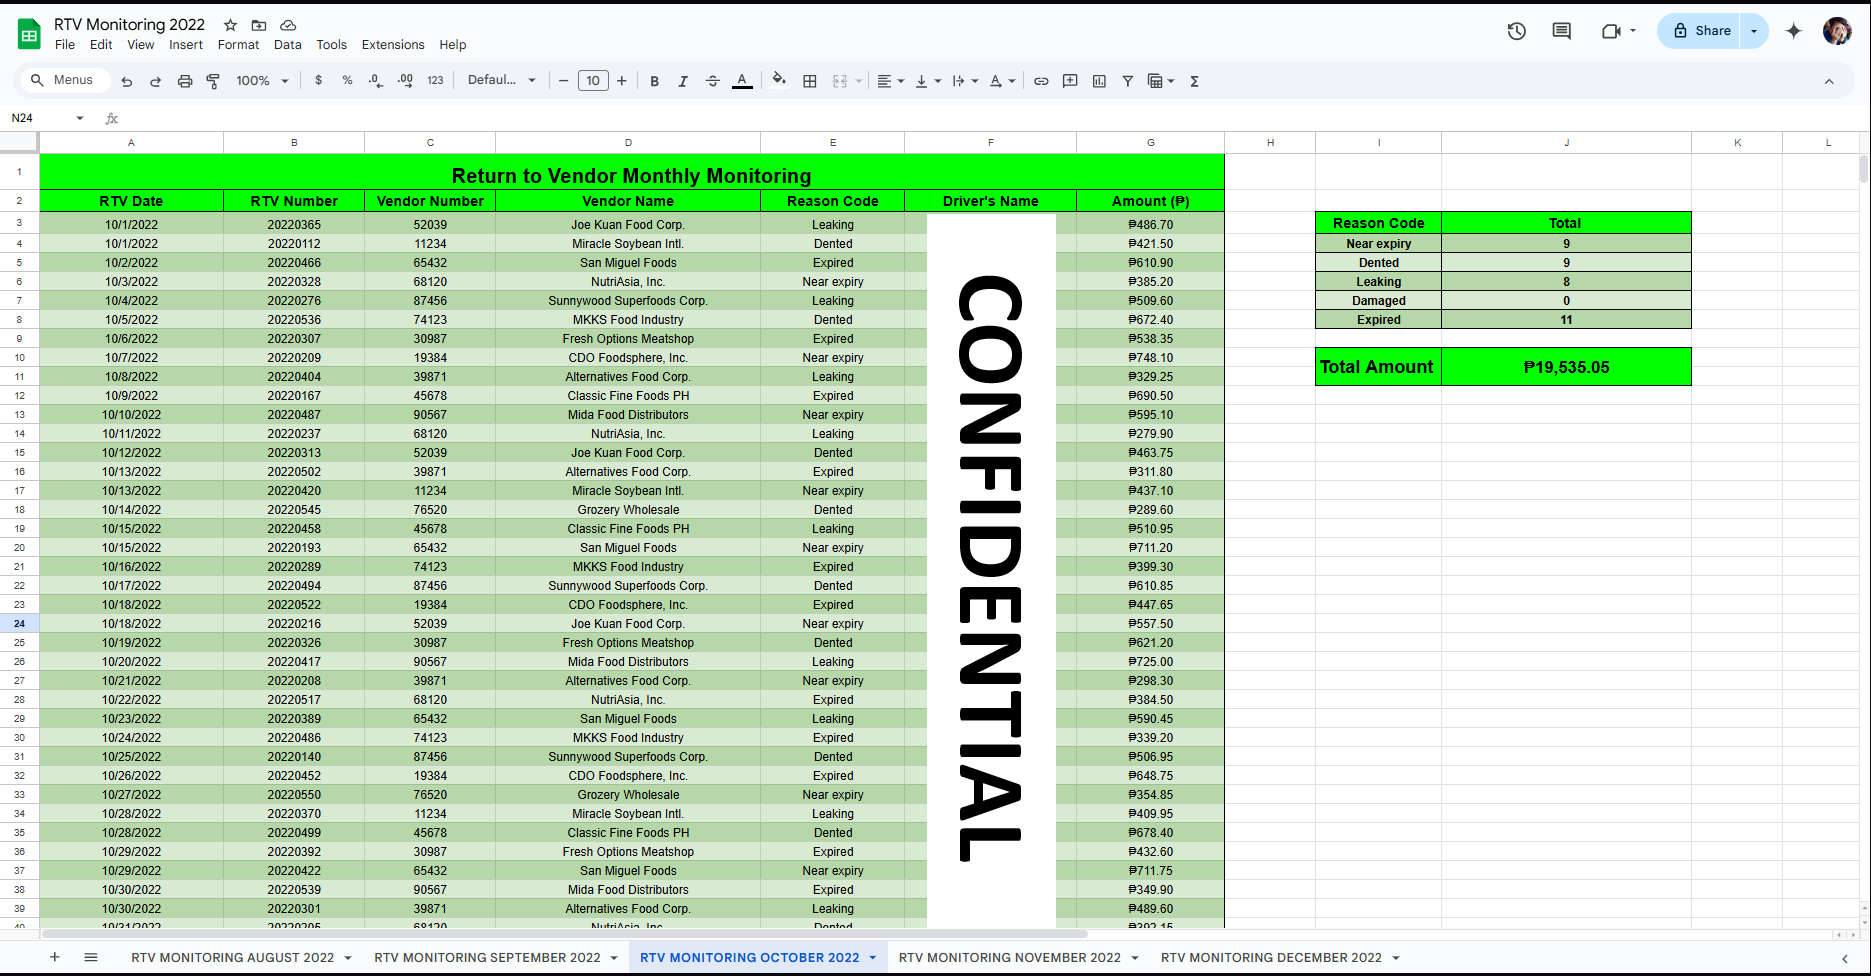
This project highlights a structured monitoring system and monthly reporting process for Bad Order (BO) items, developed as part of my responsibilities as a BO Custodian for Puregold, one of the Philippines’ leading supermarket and retail chains. Using Google Sheets, the dashboard ensures efficient tracking, categorization, and return-to-vendor (RTV) processing of unsellable items, including damaged, expired, etc.
Skills Demonstrated:
Inventory documentation and process tracking
Data structuring and cleaning
Conditional formatting for item status visualization
Use of key analytical formulas: SUMIF, COUNTIF, COUNTA
Compliance monitoring and vendor coordination
Summary dashboard creation for monthly insights
What’s Included in This Google Sheets File:
Categorized by issue type (e.g., Damaged, Expired, Leaking, etc.)
Total count of BO items per category per month using COUNTIF
Monthly total value of BO items using SUMIF
Entry completeness checks using COUNTA to ensure data health
Tools used: Google Sheets
Title: Real Estate Property Data Dashboard (Mock-up Sample)
Description:
This project demonstrates a structured data table and a simple summary dashboard for real estate property tracking. It showcases basic data visualization and analysis using conditional formatting, formulas, and a summary sheet.
Skills Demonstrated:
Data cleaning and structuring
Conditional formatting for visual clarity
Basic analytical formulas (COUNTIF, AVERAGE, COUNTA)
Creating a simple, user-friendly dashboard
What's Included in This File:
Data Table ("Property Data" Sheet):
Structured data with filters and table styling.
Conditional formatting:
🔴 Red for Foreclosure
🟡 Yellow for Pre closure
🟢 Green for Sold
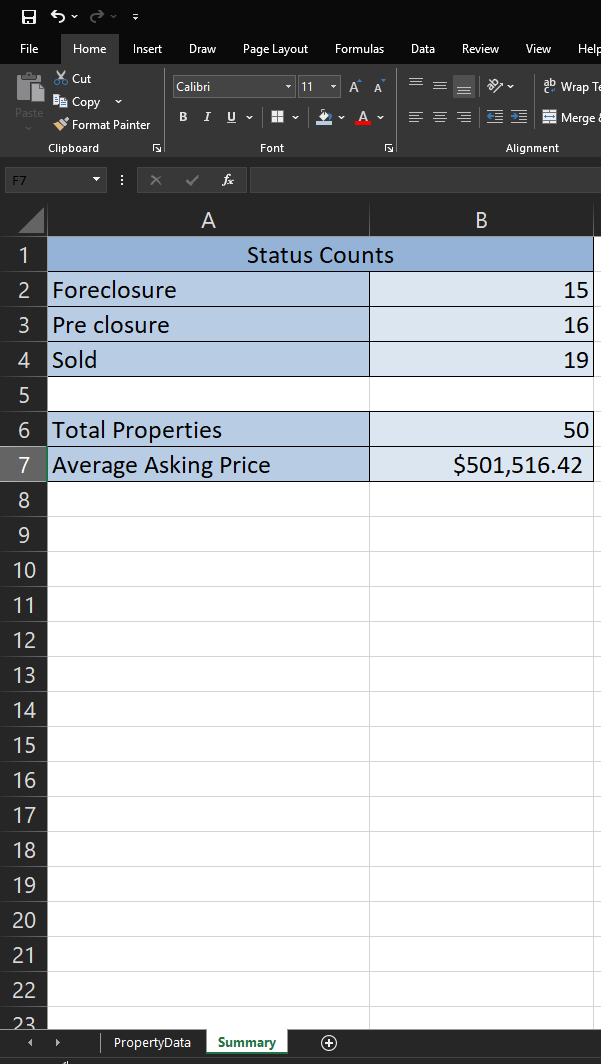
Summary Dashboard ("Summary" Sheet):
Total number of properties
Average asking price
Count of properties by Status using COUNTIF()
Basic use of AVERAGE() and COUNTA()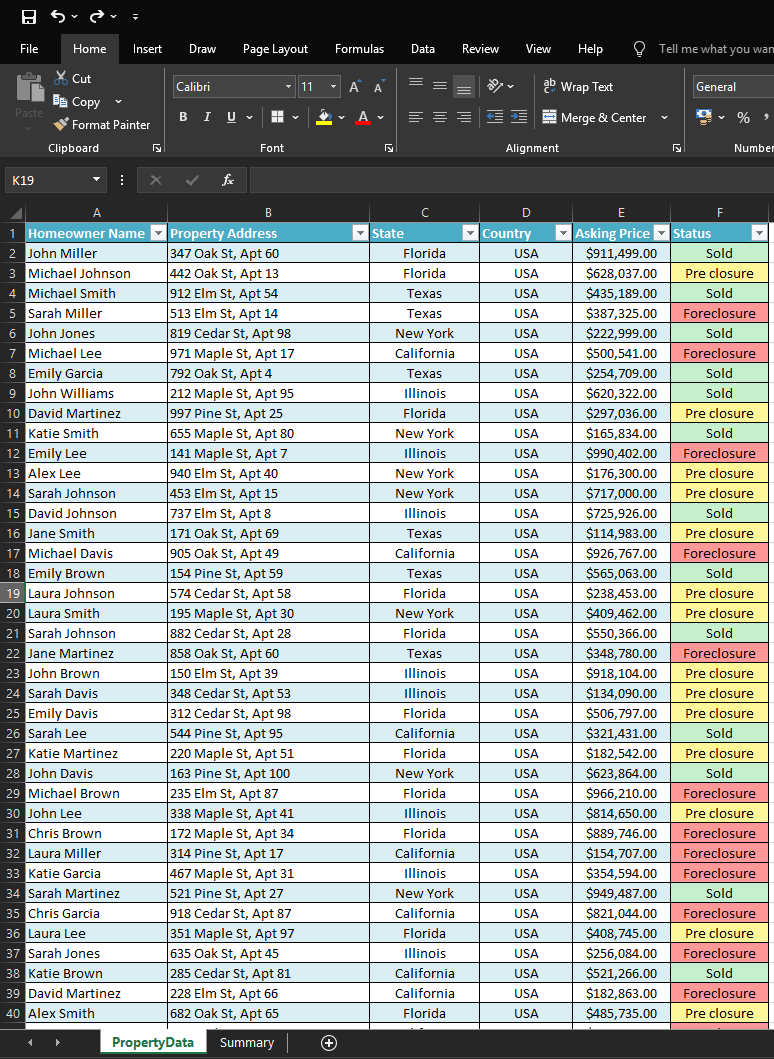
Tools used: Microsoft Excel
Title: Los Angeles Lakers Performance Dashboard (Mock-up Sample)
Description:
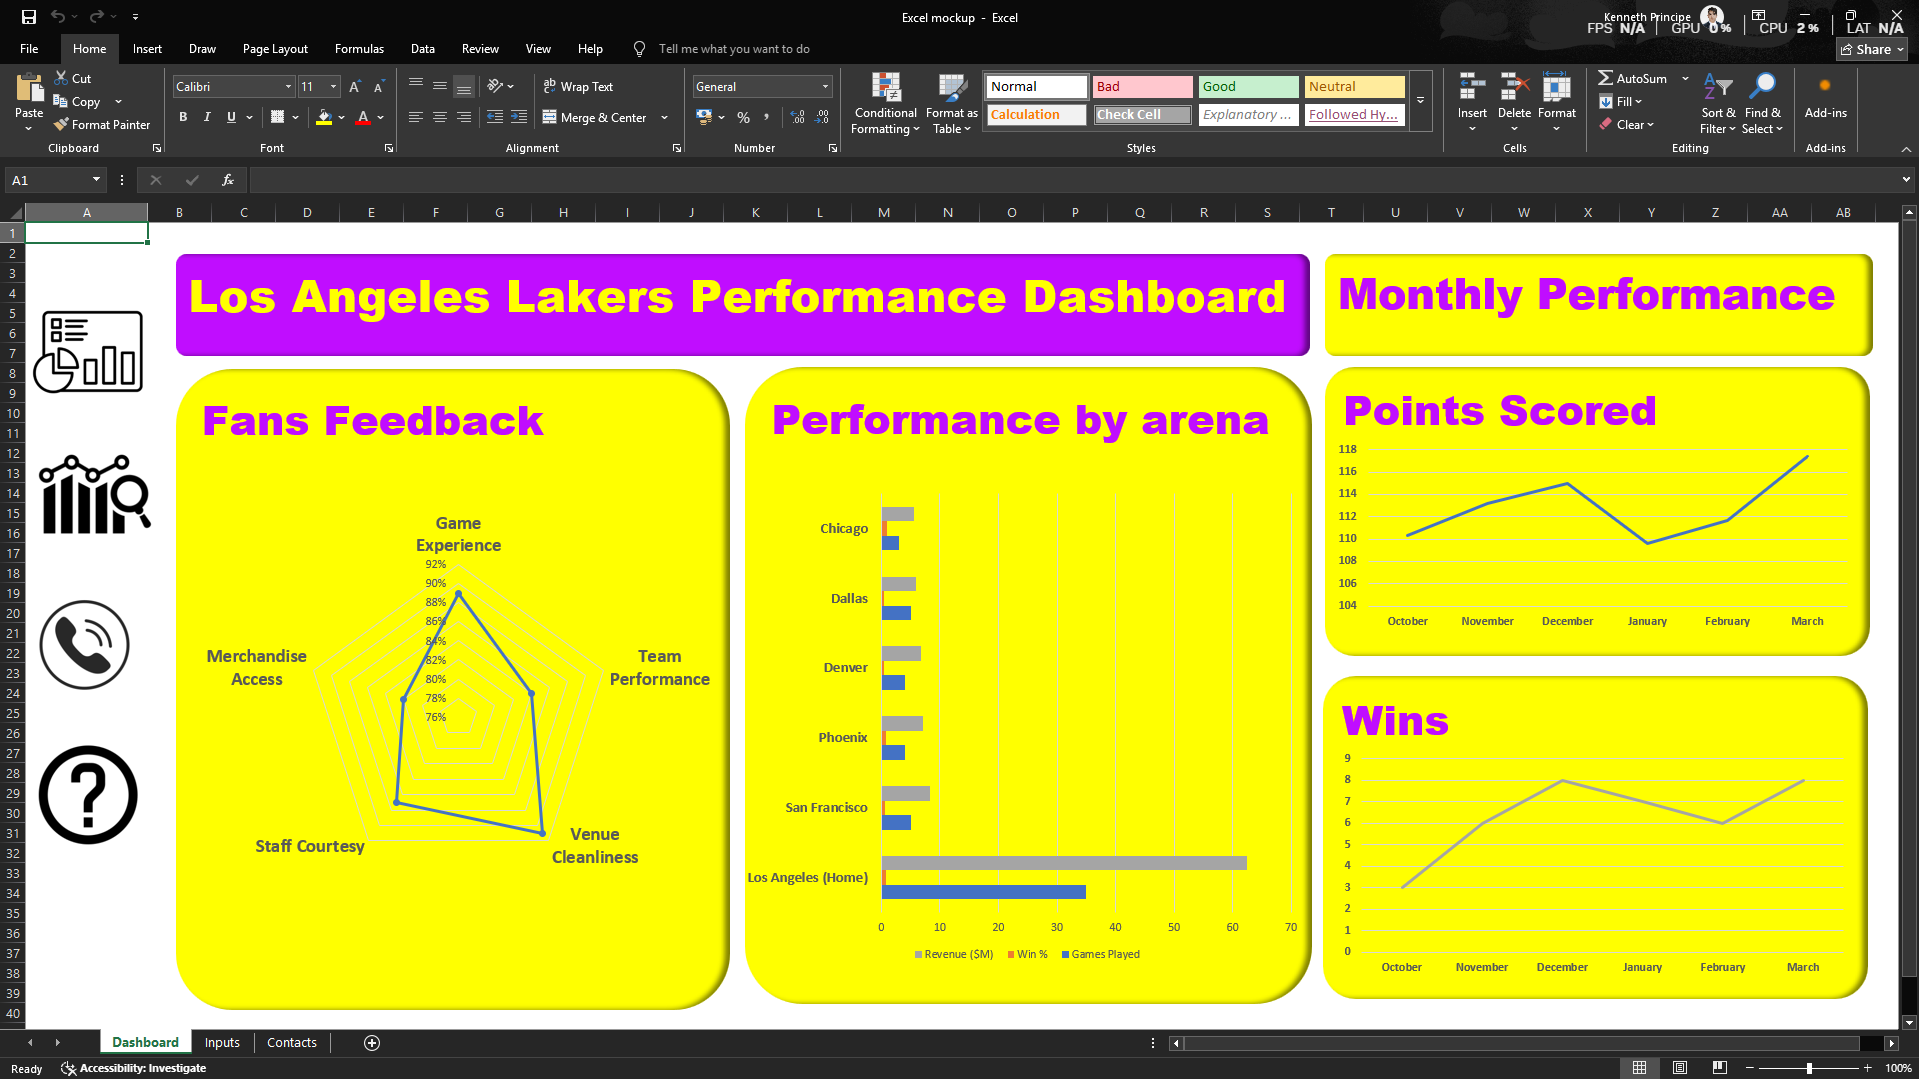
This Excel-based mock-up dashboard visualizes key performance metrics for the Los Angeles Lakers, integrating fan sentiment, location-based analytics, and month-over-month game statistics. It features an intuitive layout with a sidebar navigation system powered by image-based hyperlinks, enhancing both usability and visual appeal.
Skills Demonstrated:
Dashboard design with linked navigation
Use of image-based hyperlinks for sheet switching
Integration of radar, bar, and line charts for multidimensional data visualization
Thematic branding and color formatting (team colors: yellow and purple)
Comparative analysis across arenas and time
What's Included in This File:
Dashboard ("Dashboard" Sheet):
Sidebar Navigation (Image-Based Hyperlinks):
Clickable icons on the left side of the dashboard link directly to other sheets:
Chart Icon → Dashboard
Analytics Icon → Inputs
Phone Icon → Contacts
Help Icon → Help/Support
Fans Feedback (Radar Chart):
Charts feedback on five key categories:
Game Experience
Team Performance
Venue Cleanliness
Staff Courtesy
Merchandise Access
Performance by Arena (Bar Chart):
Displays:
Revenue ($M)
Win %
Games Played
across multiple cities (home and away games)
Monthly Performance (Line Charts):
Points Scored: Tracks points per game by month (Oct–Mar)
Wins: Monthly count of team victories
Navigation & Interactivity:
All navigation is managed via images in the sidebar, creating a clean and intuitive interface.
Users can jump between:
Dashboard (overview)
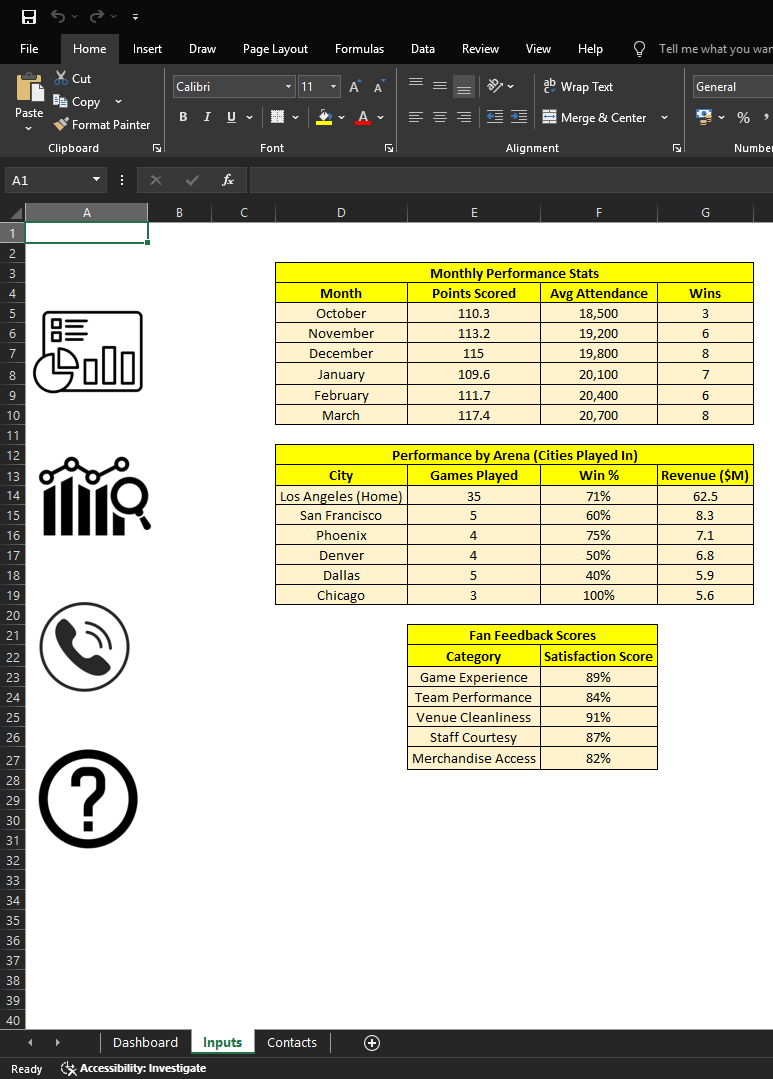
Inputs (data entry or raw stats)
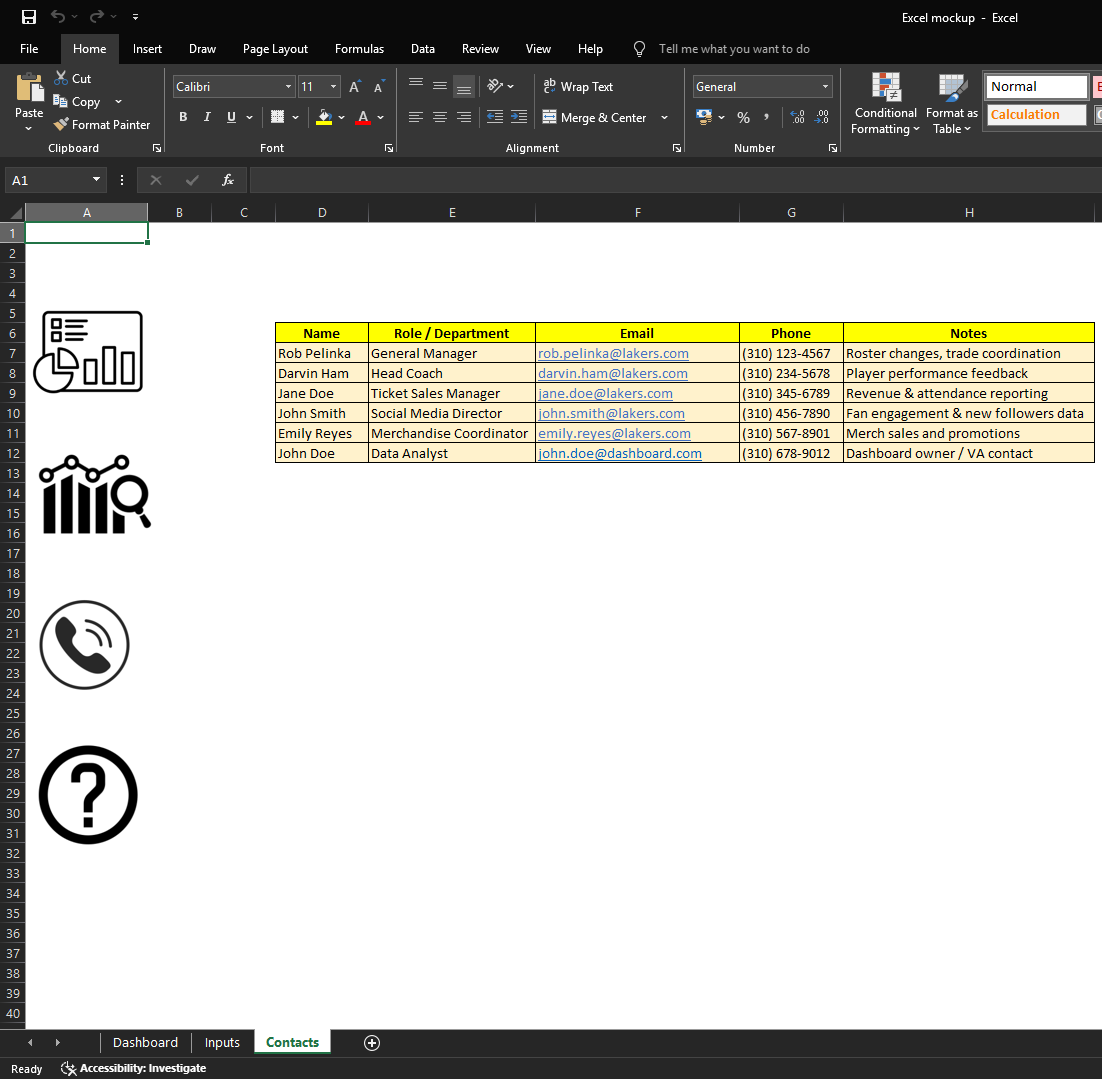
Contacts (team or project-related contact info)
Tools used: Microsoft Excel
Title: monkeytype.com High Scores
Description:
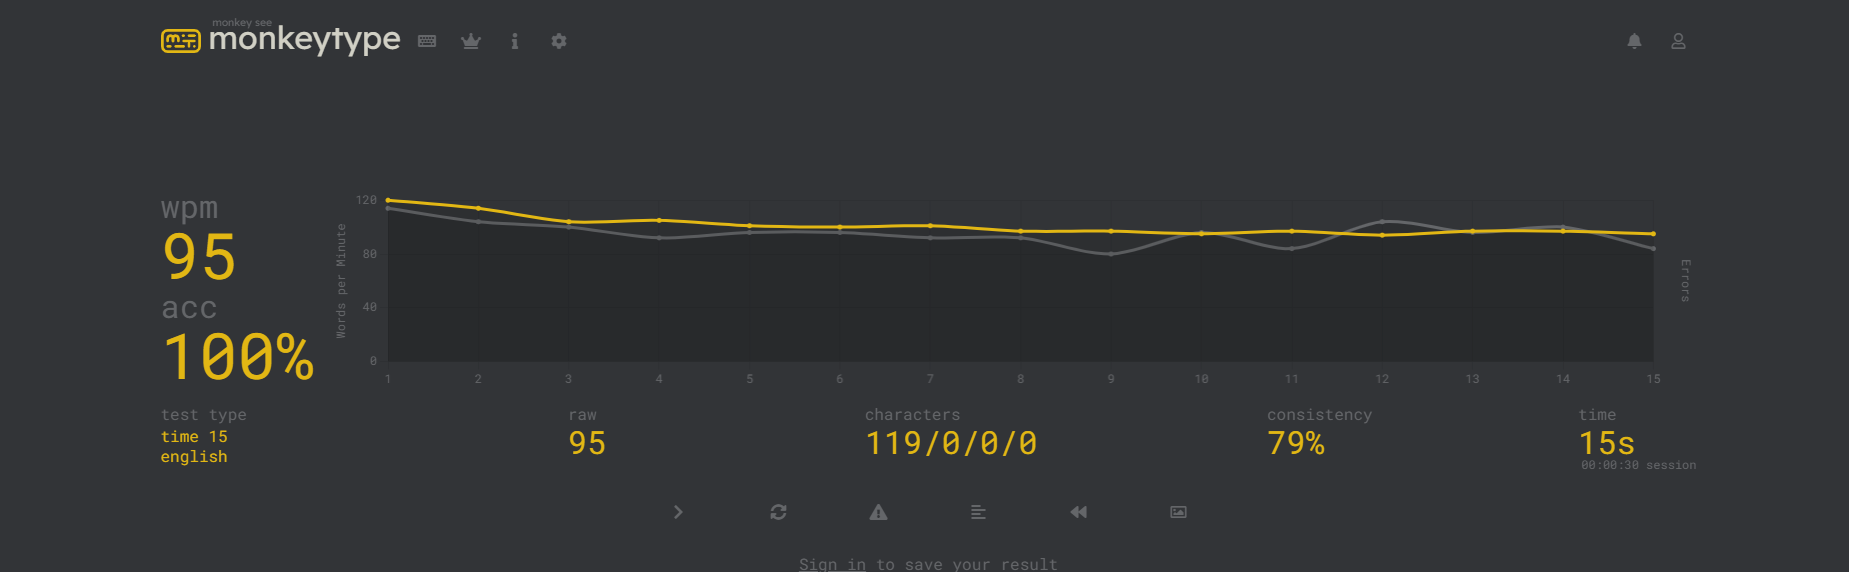
Below are my personal typing speed records from the website "monkeytype.com". Please note that these are individual high scores recorded over short sessions and may not fully reflect sustained or task-specific typing performance. Actual typing speed may vary depending on factors such as content complexity, typing conditions, and familiarity with the material. These records, however, give a general indication of my typing proficiency and responsiveness under time constraints.
Skills Demonstrated:
Here's my 30s record: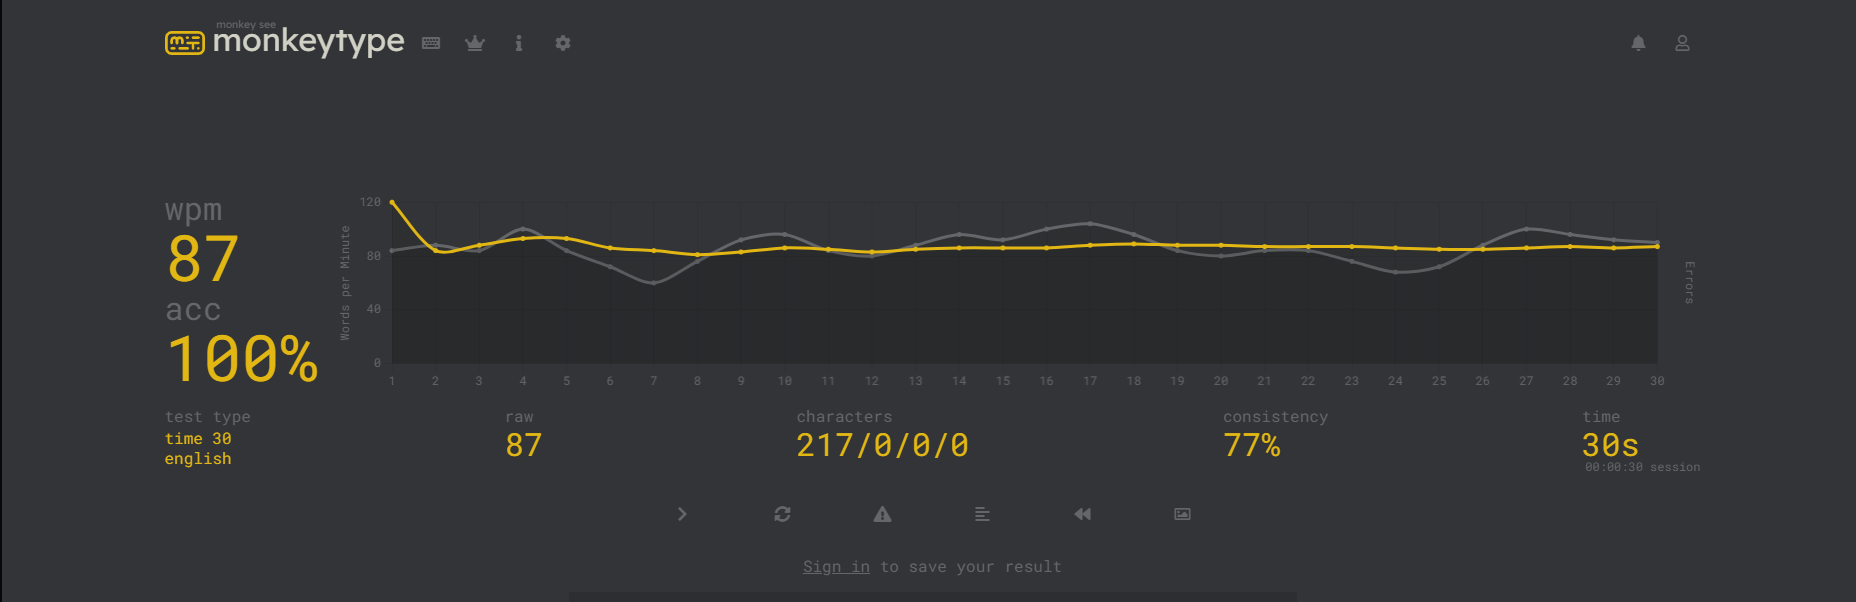
And here's my 15s record:
Tools used: monkeytype.com