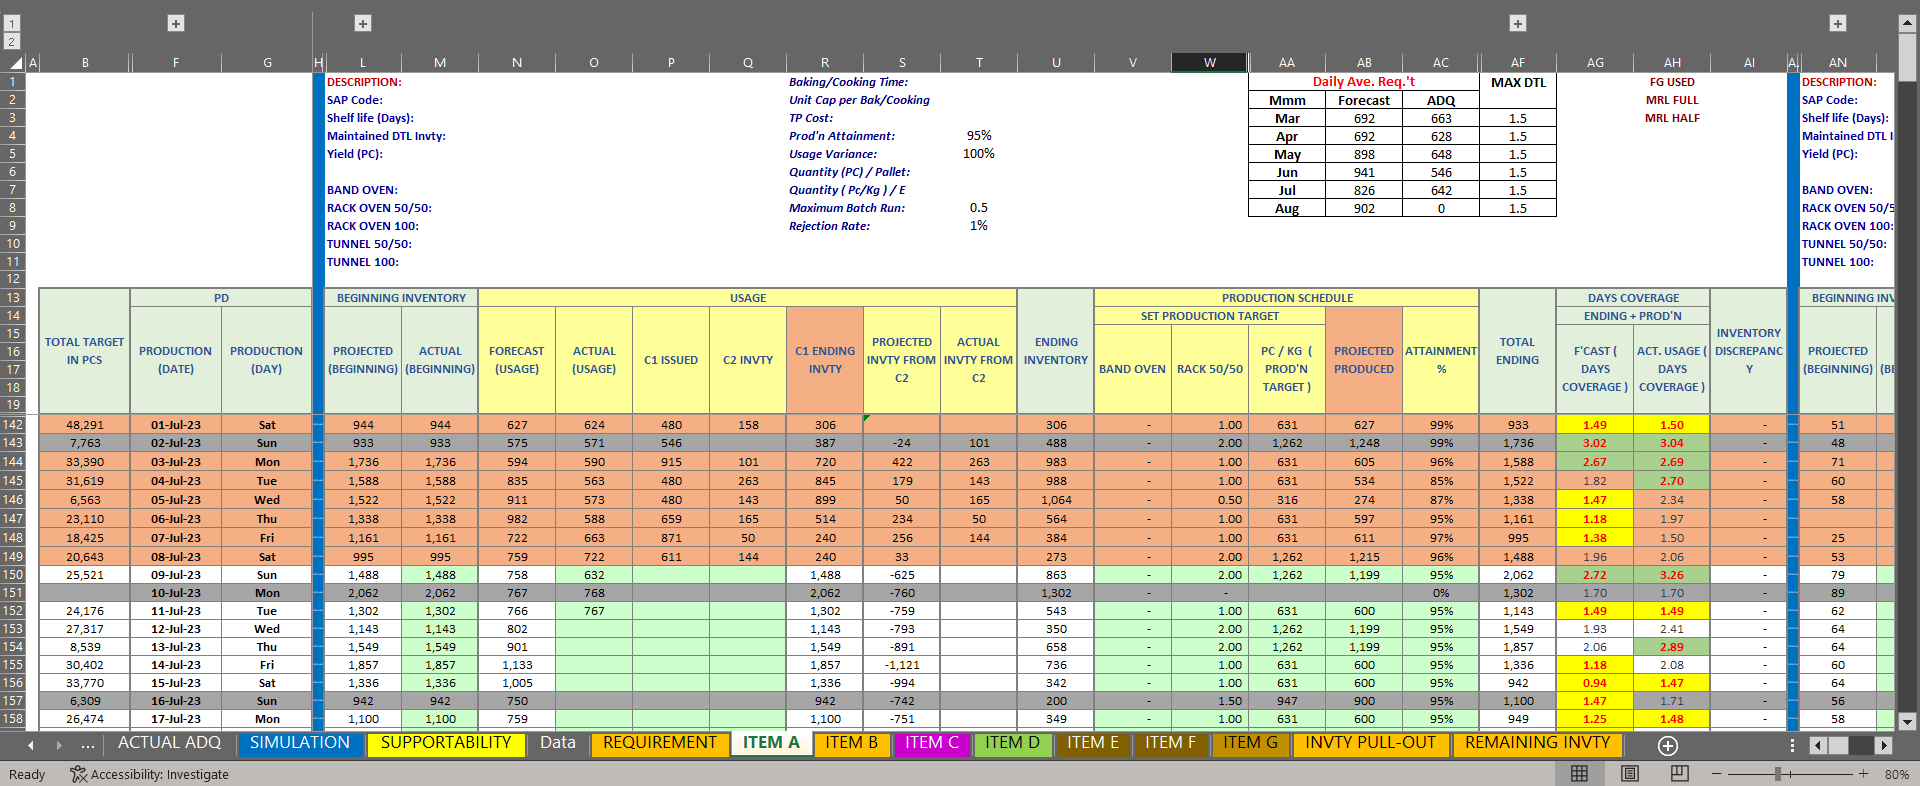
Stock Supportability Report
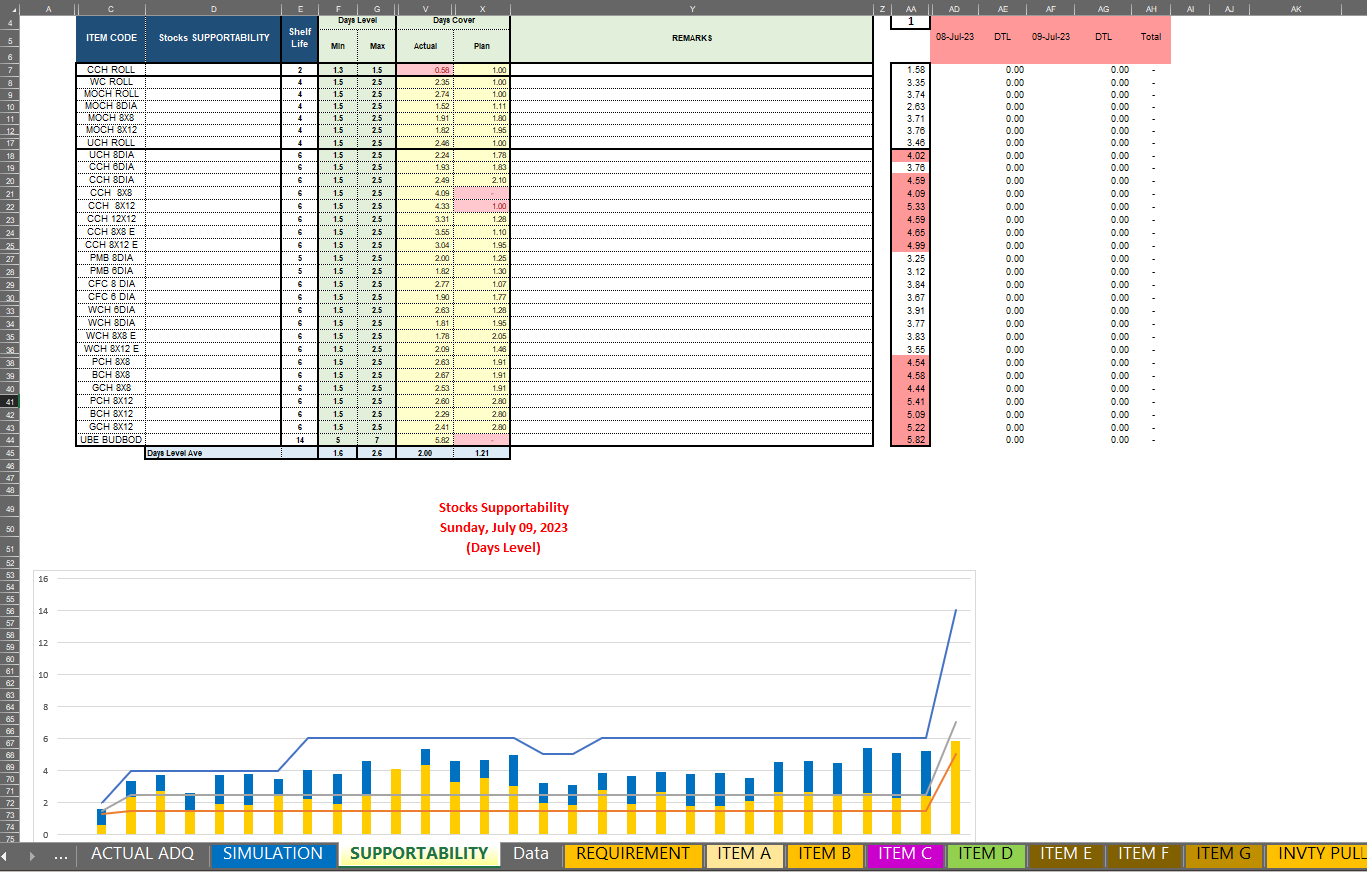
This shows the inventory supportability based on the beginning inventory over the requirement needed, the yellow bar shows how many days can support the available stocks, the blue bar shows how many days can support the ongoing target. The blue line shows the maintaining inventory should be keep avoiding overstock of items.