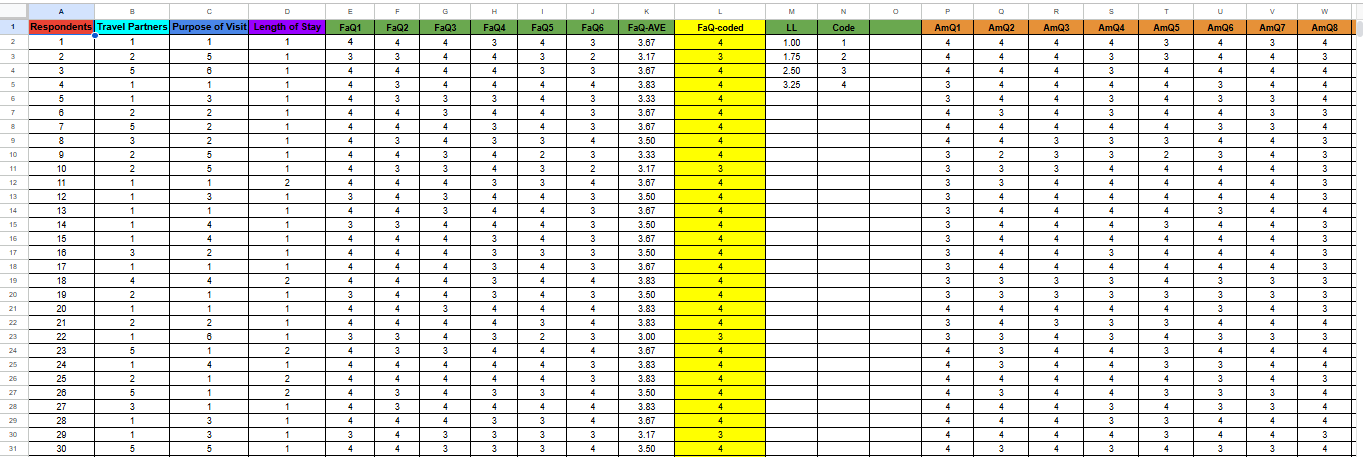
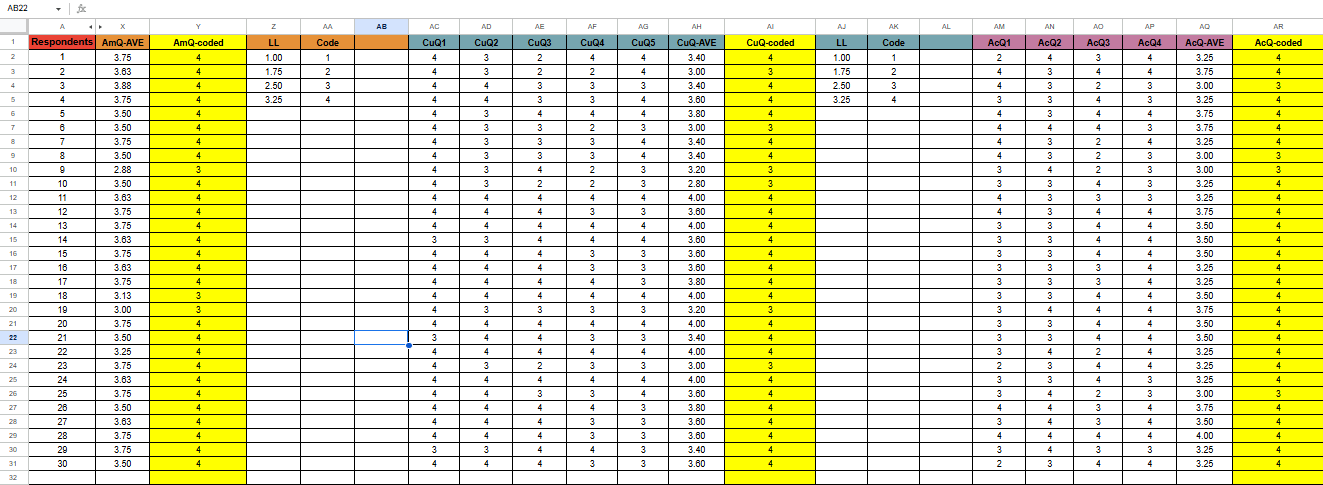
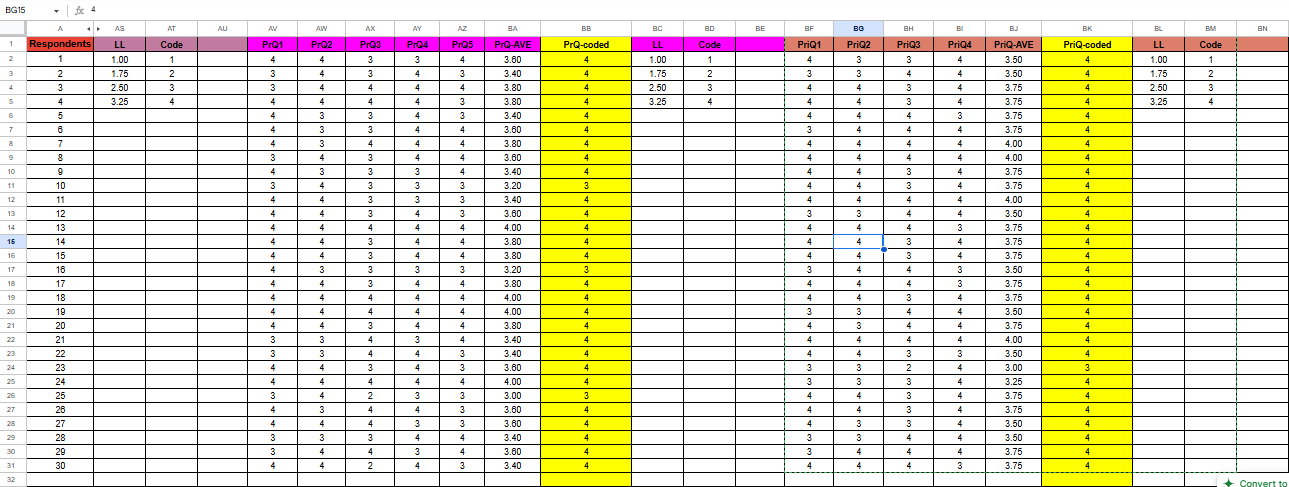
DATA ENTRY - Encoding Research

Google Sheets was used to encode and tally the data collected. To make things easier, I get the sum and average of each respondent. Adjust the column width for perfect fit and use colors to identify each category of the questions.
After encoding and tallying data, I used Google Docs to present the data that had been collected. Discuss what is in them and provide a table using Google Sheets that summarizes the answers of the respondents. I also put the page number and adjusted the paper margins.