DATA ENTRY

30 Philippine CEOs & Companies (2025)
Compiled, cleaned, and structured a dataset of the 30 CEOs and Companies in the Philippines, including financial metrics, sector classifications, and social media presence. The project demonstrates accuracy, attention to detail, and visualization skills.
Sample Dataset
30 Philippine CEOs & Company
Profiles 2025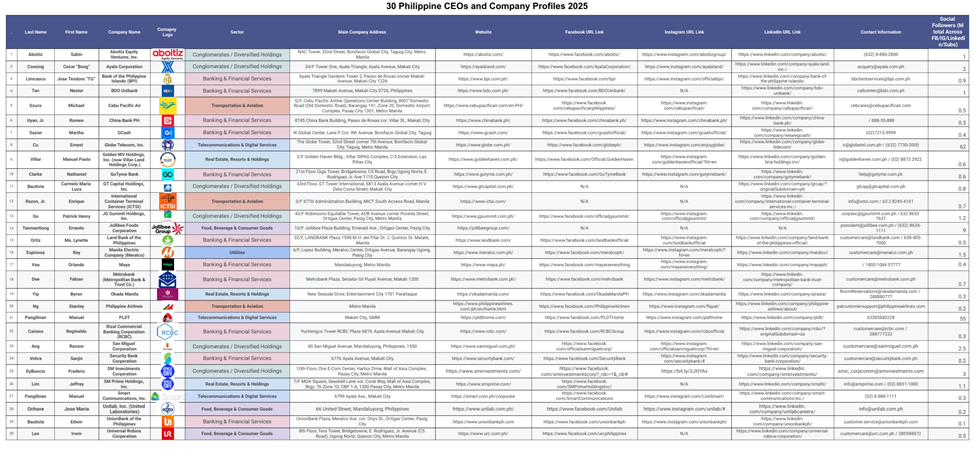
Visual 1
This comprehensive table provides detailed profiles of the 30 CEOs and their respective companies in the Philippines. Each entry includes the CEO’s full name, company name, logo, sector, corporate headquarters address, official website, social media links, and total social media following (millions across Facebook, Instagram, LinkedIn, etc.).
Skills Highlighted:
✔ Data collection & validation
✔ Formatting multi-field datasets (names, addresses, social links)
✔ Integration of company logos & contact info
Visual Insights
Distribution by Company Count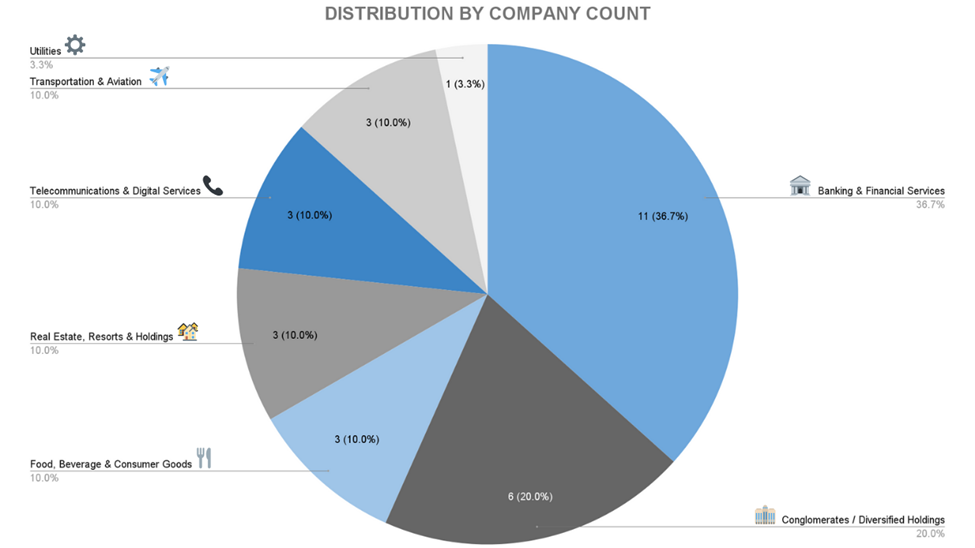
Visual 1.1
This pie chart illustrates the number of companies per sector in the dataset. Banking & Financial Services (36.7%) and Conglomerate / Diversified Holdings (20.0%) dominate the company count, showing how heavily the Philippine corporate landscape is concentrated in finance-related sectors. Other sectors like Real Estate, Telecom, Food, and Utilities make up the rest.
Skills Highlighted:
✔ Categorization & data cleaning
✔ Sector grouping & visualization
30 Philippine Companies Leaderboard (2024)
Compiled financial data (assets, revenues, followers) of the Top 30 Philippine companies. Applied normalization and scoring formulas to generate a leaderboard ranking based on combined financial strength and digital presence.
Sample Dataset
2024 Philippine Companies Leaderboard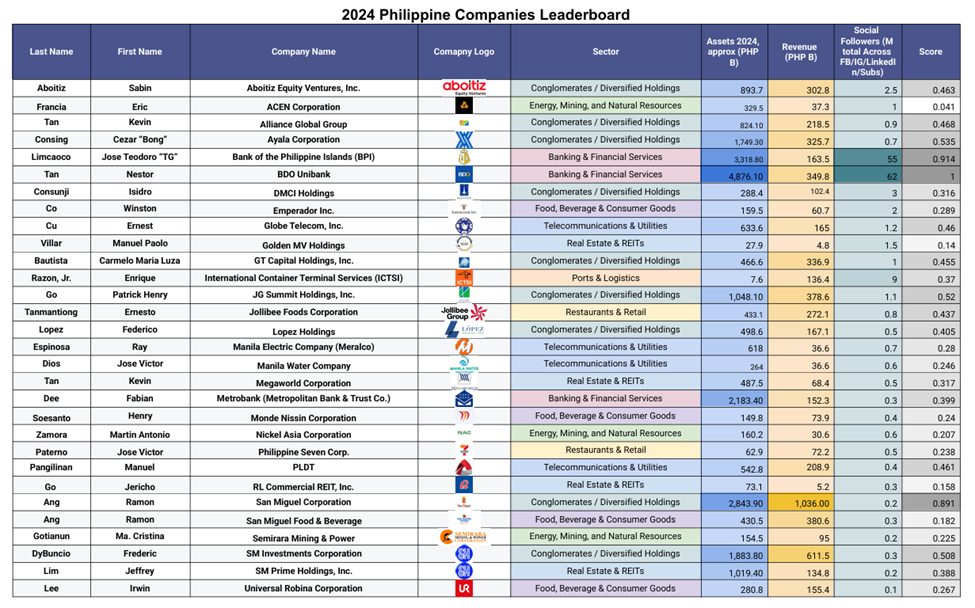
Visual 2
This structured table consolidates each company’s sector, financial metrics, social media presence, and overall score. Company logos were inserted for professional presentation. The table consolidates financial performance and social influence of the top 30 companies, demonstrating how scale and online presence interact in shaping corporate rankings.
Skills Highlighted:
✔ Large dataset handling (billions in financial figures)
✔ Normalization (min–max scaling)
✔ Composite scoring system
✔ Data integration
Visual Insights
Distribution of Assets by Sector - 2024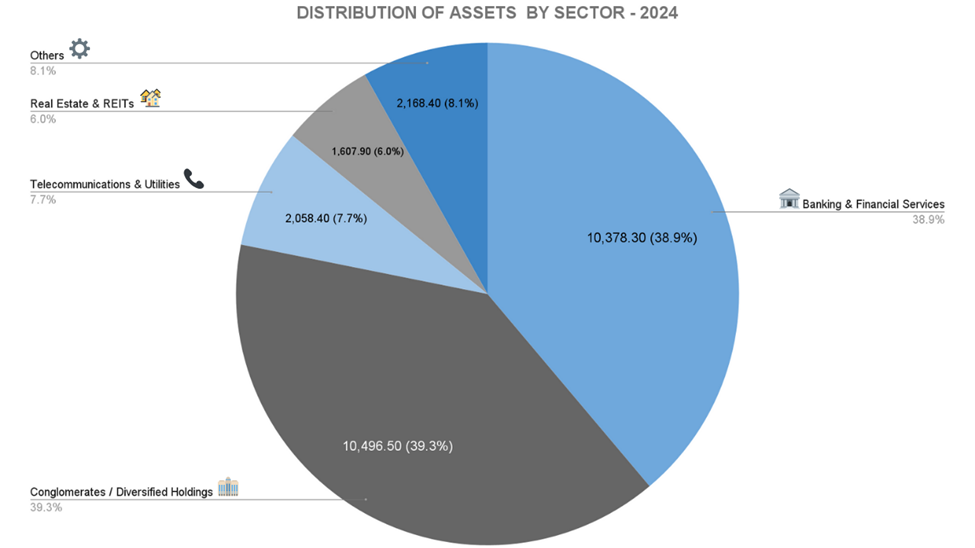
Visual 2.1
This pie chart breaks down asset concentration per sector. Banking & Financial Services dominate with ₱10.37T (38.9%), followed by Conglomerates and Diversified Conglomerates, confirming the sector’s central role in the Philippine economy.
Top 10 Philippine Companies by Assets
(Php Billions)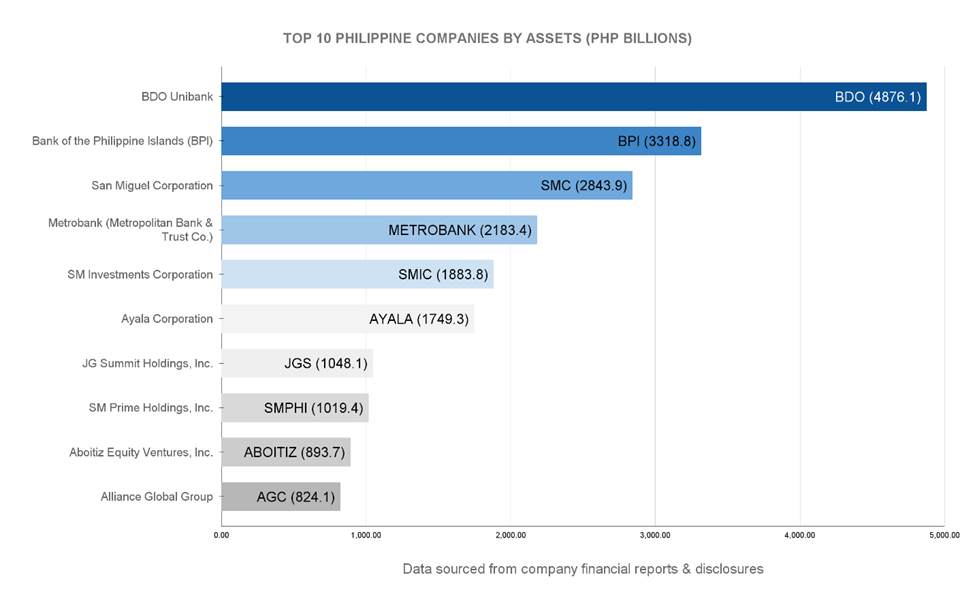
Visual 2.2
This chart ranks companies by total assets. BDO Unibank leads with ₱4,876B, highlighting the strong dominance of the banking sector in terms of financial strength, followed by BPI and San Miguel Corporation.
Top 10 Philippine Companies by Revenue
(Php Billions)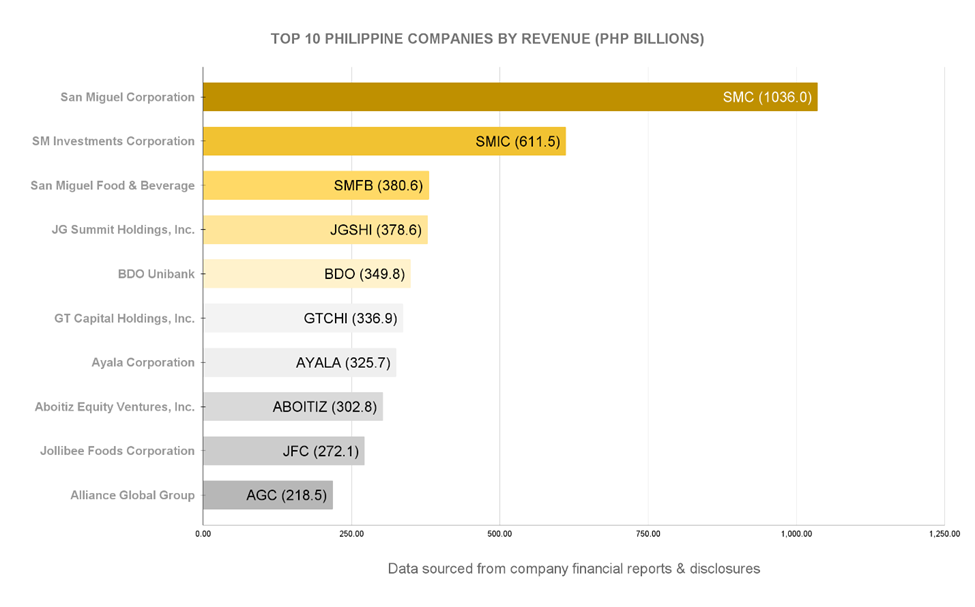
Visual 2.3
This bar chart highlights the top revenue-generating companies. San Miguel Corporation leads with ₱1,036B, followed by SM Investments and San Miguel Food & Beverage. San Miguel Corporation leads with ₱1,036B in revenue, almost double the next competitor, underscoring its unmatched scale in the Philippine market.
Top 15 Philippine Companies Leaderboard
(2024)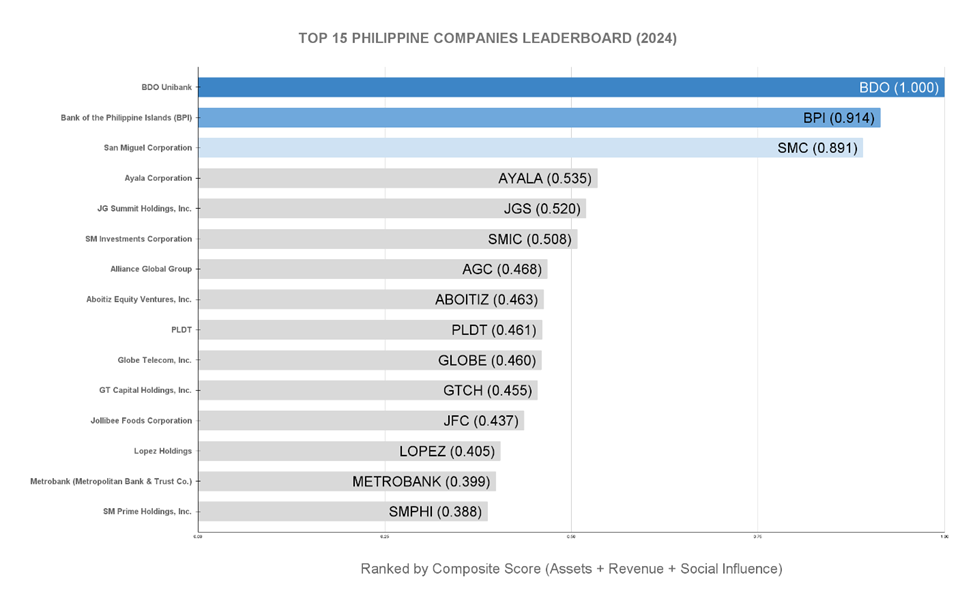
Visual 2.4
Bottom 15 Philippine Companies
Leaderboard (2024)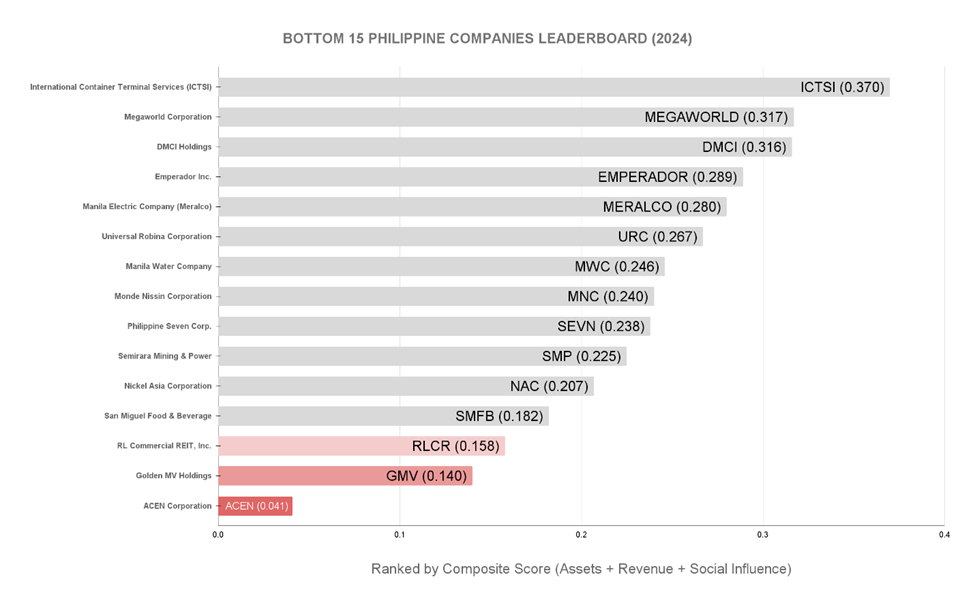
Visual 2.5
This horizontal bar chart presents a leaderboard based on a composite score (Assets + Revenue + Social Influence). BDO Unibank, BPI, and San Miguel Corporation secure the top three spots (Visual 2.4), reflecting the strength of banking and conglomerates in combined assets, revenue, and influence. While, ACEN Corporation, Golden MV Holdings, and RL Commercial REIT trail at the bottom (Visual 2.5), shows how smaller firms in energy and real estate compare modestly against large conglomerates.
Skills Highlighted:
✔ Ranking systems & leaderboards
✔ Chart formatting (horizontal bar, comparison)
✔ Business insight generation
Tools & Techniques Used
· Excel/Google Sheets (formulas, VLOOKUP, normalization, ranking)
· Chart creation (pie, bar, leaderboard)
· Data cleaning, sector categorization, and professional presentation
Key Takeaway
This demonstrates my ability to go beyond data entry—not only encoding but also cleaning, categorizing, ranking, and presenting insights visually for decision-making.