Lead Generation

My attached work is below. You can also view it through this link.
https://docs.google.com/spreadsheets/d/1M-lssW01SxTDo3zYeZgf95bdqEZDvaBGiuY7bPeHoKU/edit?usp=sharing
In this assignment, I analyzed the engagement performance of three LinkedIn posts, evaluating metrics such as likes, comments, reposts, and engagement rate. The posts included a mix of text and image content, each focusing on different topics:
-
"ChatGPT is old news, because of the new DeepSeek" (Text) – 522,200% engagement rate, which resonated by educating and empowering the audience with timely insights on AI technology.
-
"BREAKING: DeepSeek just released an image model" (Image) – 493,300% engagement rate, tapping into the viral potential of disruptive, affordable, and accessible new tech.
-
"LinkedIn isn’t broken. But the rules have changed." (Image) – 396,200% engagement rate, engaging the professional community with insights on evolving LinkedIn strategies.
Through this analysis, I identified key trends, including the higher engagement rates of AI-related and disruptive technology content, as well as the superior performance of image-based posts. This project demonstrated my ability to analyze social media data, extract actionable insights, and provide recommendations for enhancing future content strategies and audience engagement.

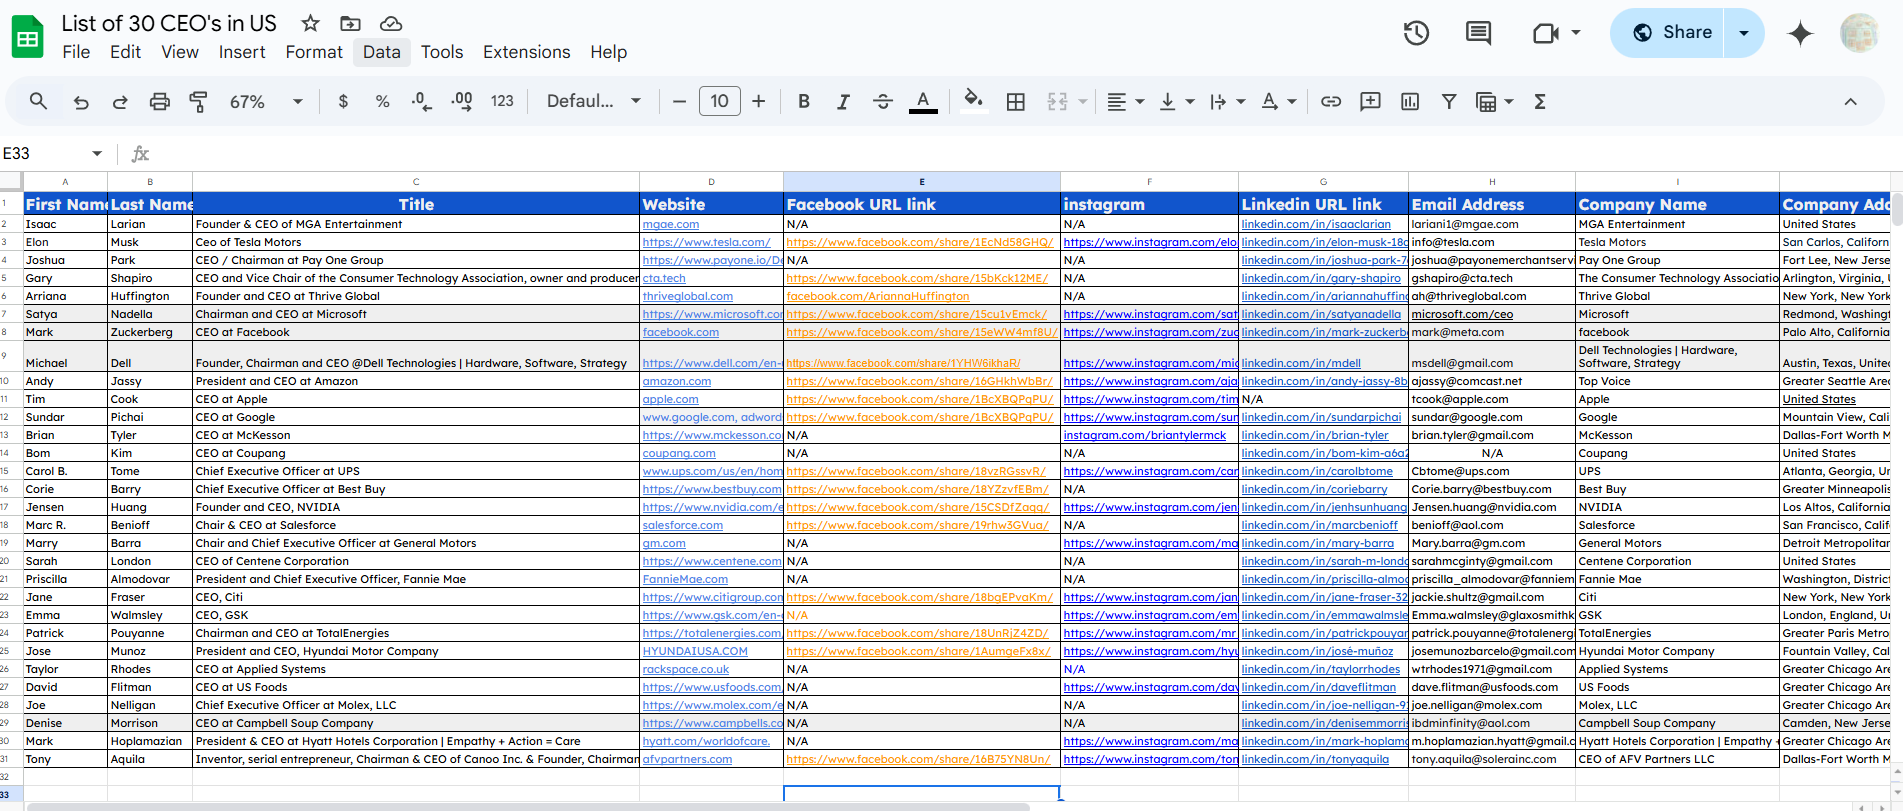
My attached work is below. You can also view it through this link.
https://docs.google.com/spreadsheets/d/1ZjAxgYsfER-DCT9TNNzq0zyPGhlYnRpsGBVDlCUnr78/edit?usp=sharing
In this sample, I provide a list of 30 CEOs in the US, including their names, company names, websites, Facebook URLs, LinkedIn URLs, Instagram URLs, phone numbers, and location. I utilize both LinkedIn and Google to find different CEOs across the country and then I store the collected information in Google Sheets.
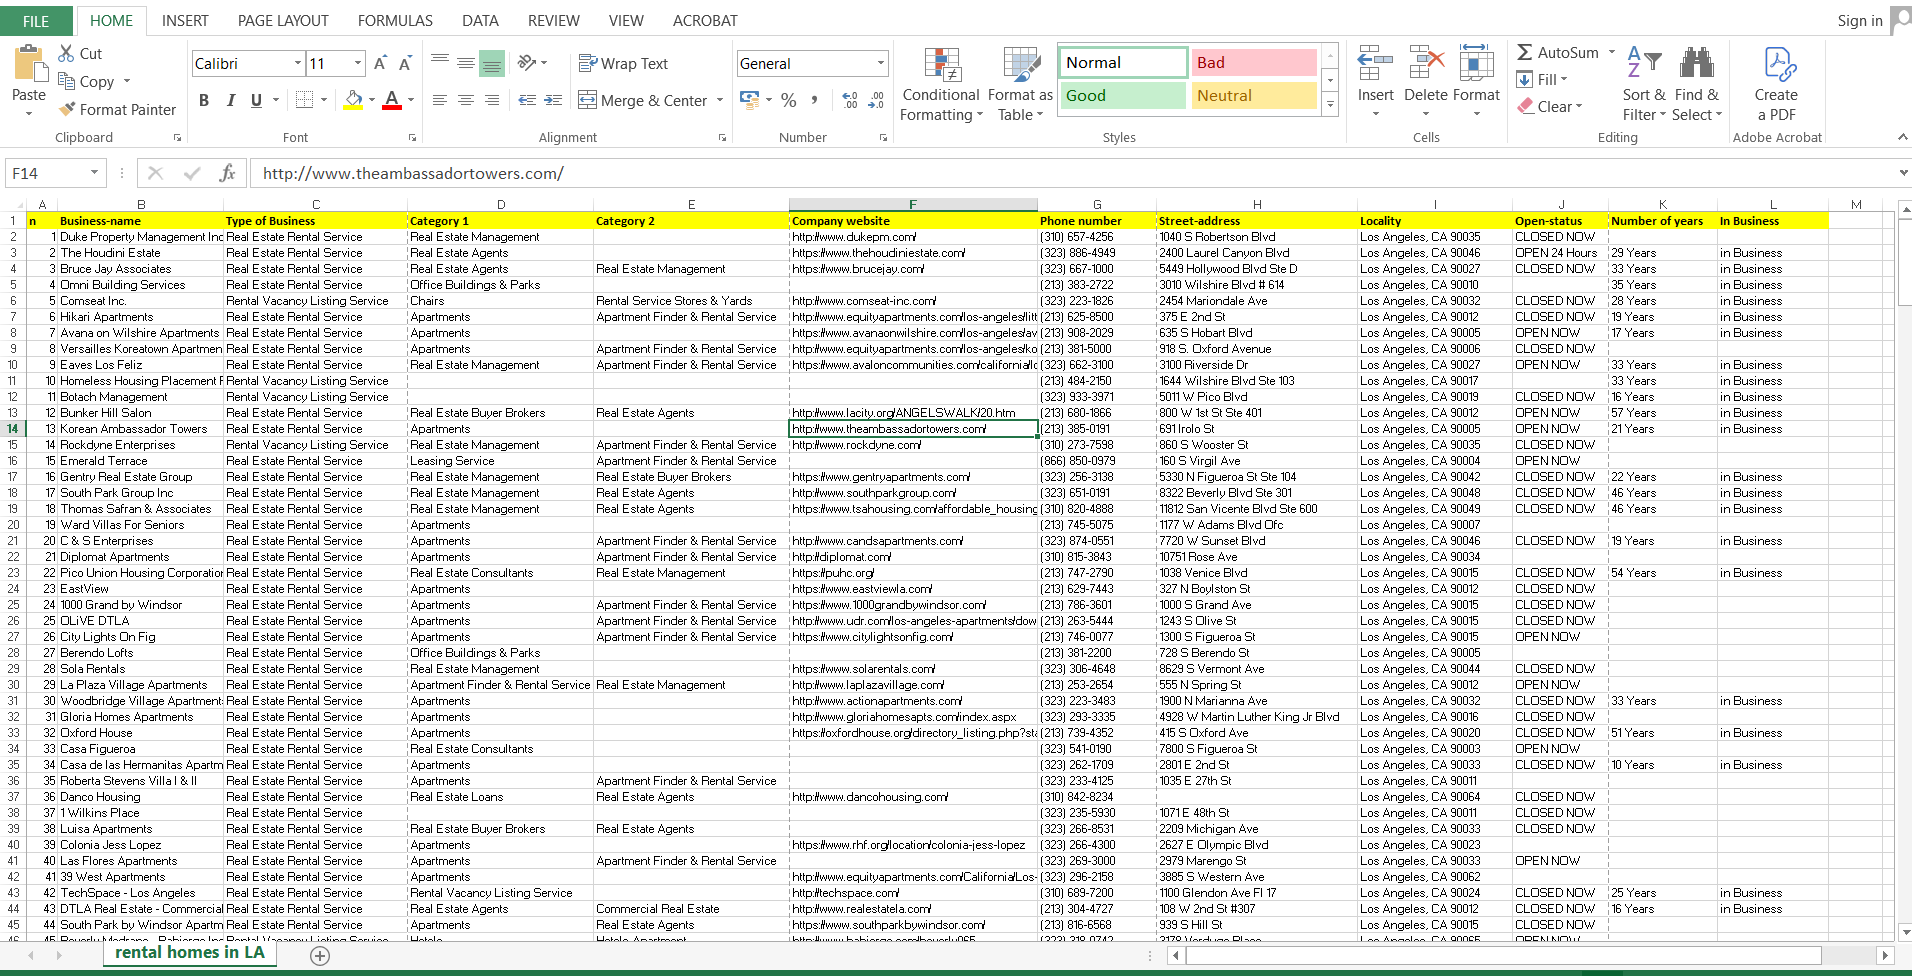
Here's another sample of Lead generator.
I've searched through 300+ rental homes in LA. Since I can only screenshot 40, you can't see the rest. I made this from scratch. I used Yellow Pages to find rental homes and Insta Data Scraper to extract all available rental homes in LA. Then, I used Excel to store the information.