Data Entry Project
SEDIMENTATION DATA
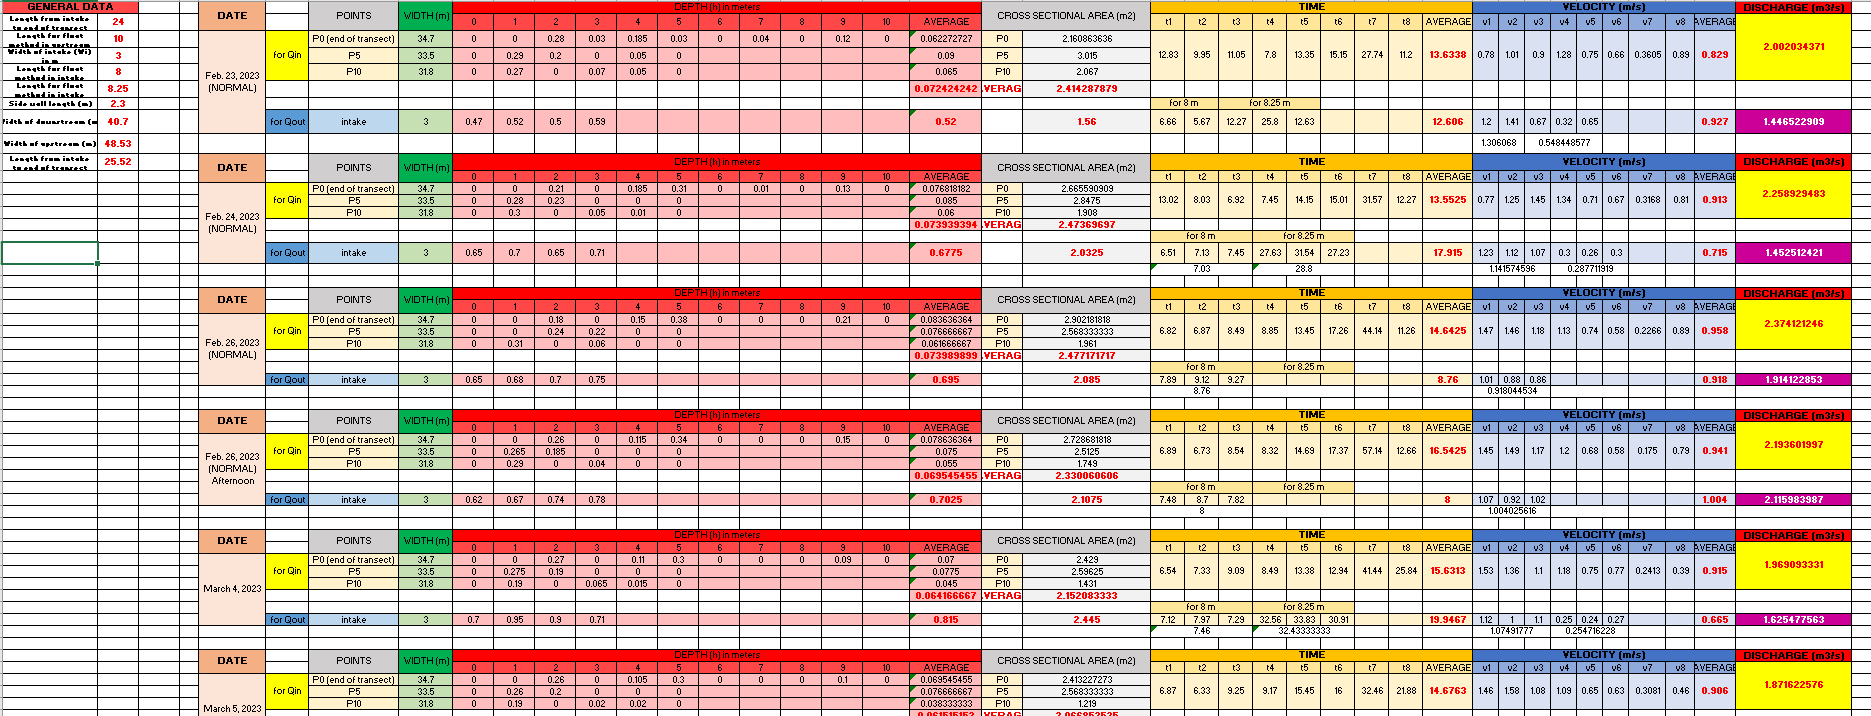
Data on water flow over time, including depth, velocity, discharge, and cross-sectional area at transect locations, are summarized in the table. Calculations are made for important parameters like width, time, and averages. The highlighted discharge values (in m³/s) indicate changes under various conditions (e.g., "NORMAL"). It is employed for hydrological analysis of river or channel water flow.
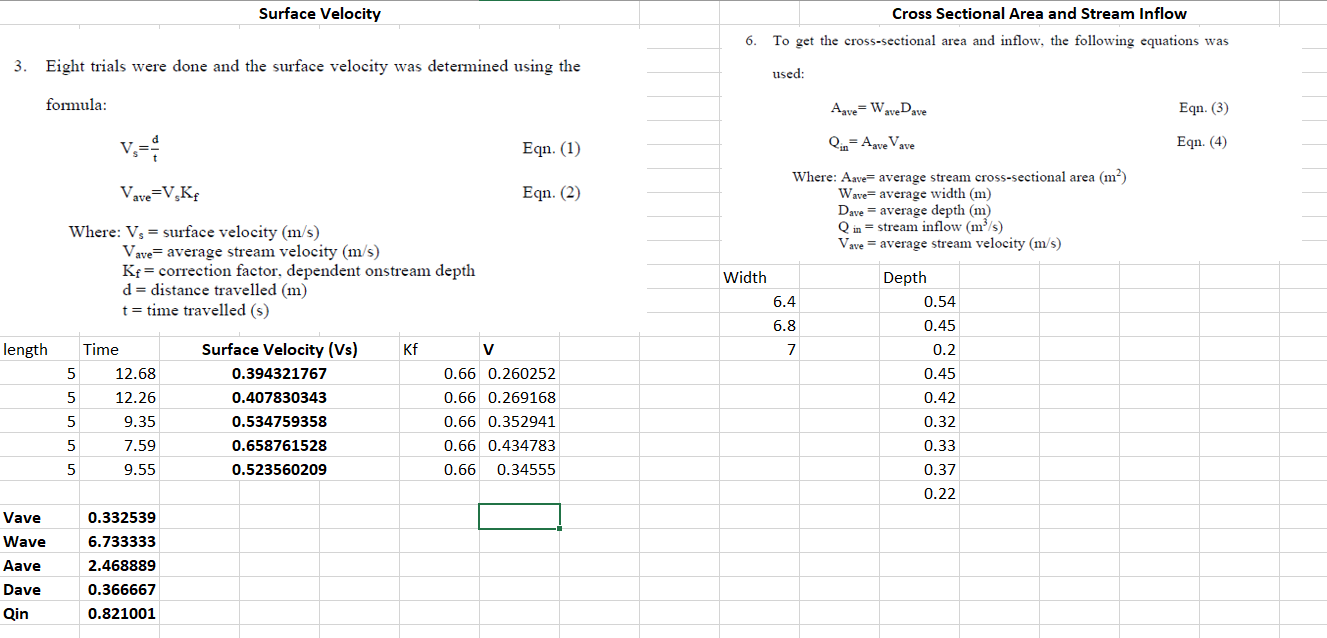
Surface velocity, cross-sectional area, and stream inflow estimations are displayed above. Distance/time is used to calculate surface velocity, and a correction factor is applied to average velocity. Stream input and cross-sectional area equations are given. Data on depth, width, velocity, and time are included in tables, and averages are computed to support hydrological flow analysis.
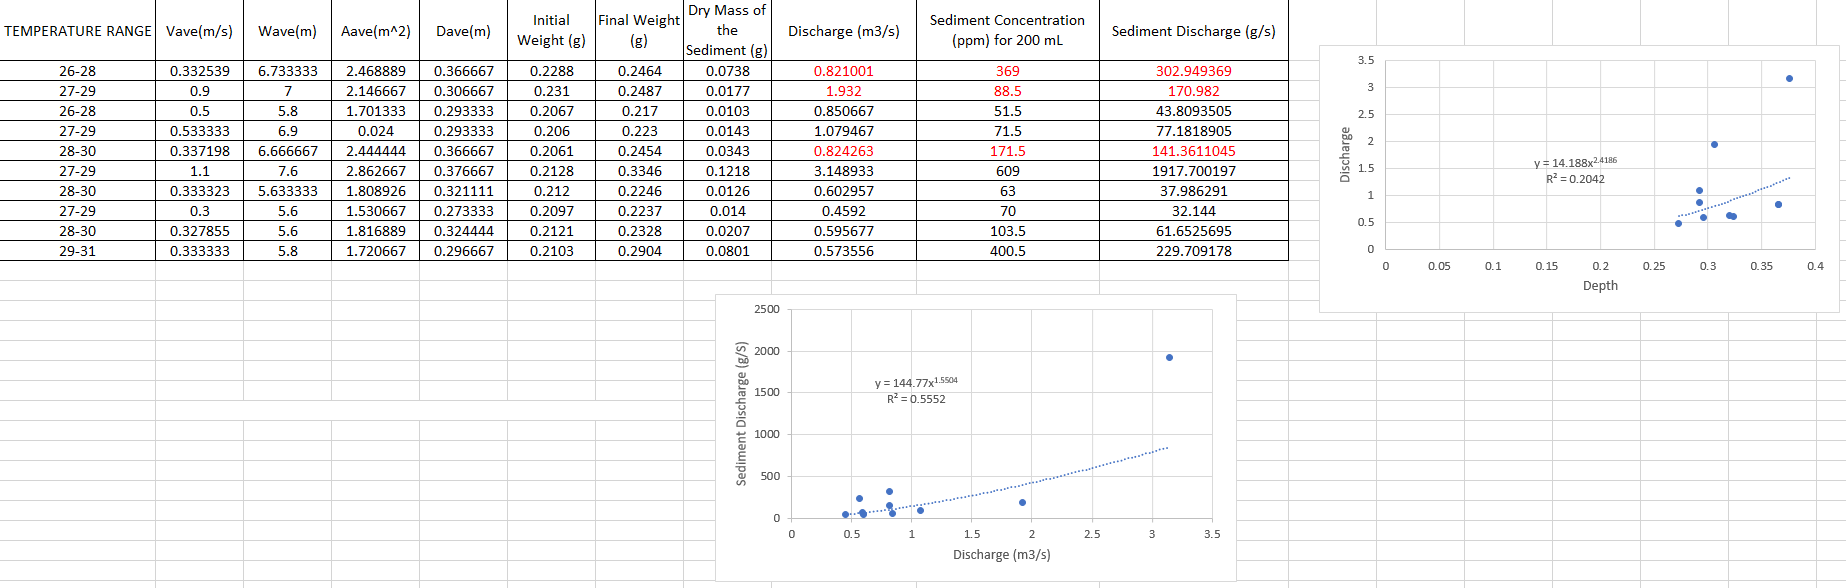
Data and analysis on sedimentation discharge in a stream are included above. Temperature range, average velocity, depth, discharge, sediment concentration, and sediment discharge are among the parameters shown in the table. Values that are highlighted highlight noteworthy outcomes. Using trendline equations, scatter plots examine two types of relationships: discharge versus depth and sediment discharge versus discharge. In order to evaluate stream dynamics, the dataset analyzes sediment transport behavior by establishing a correlation between flow features and sediment discharge rates.
TYPING SPEED TEST