Monthly Test Census
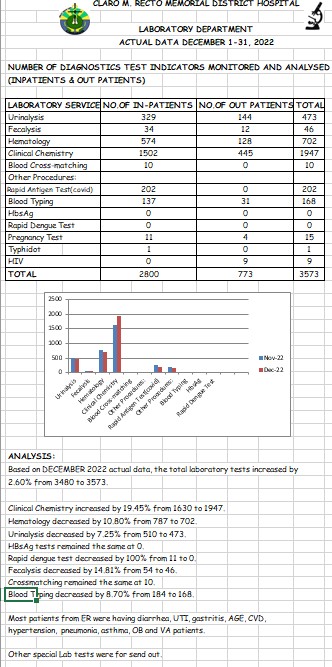
I recorded the number of each available laboratory test each month and compared it to the previous month. Then, I visualized and analyzed the data into a graph to show comparison between months.